
The Breakout of VIX

Key points:
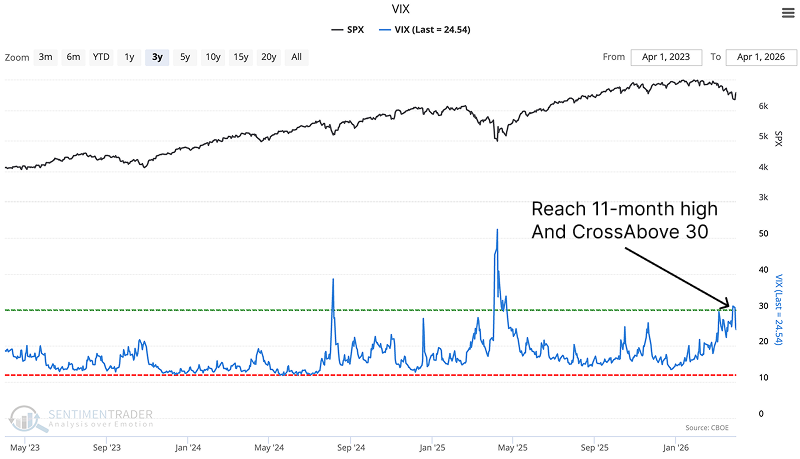
- The VIX crossed 30.
- Increased to the highest level in the previous 11 months
- The VIX had not exceeded 30 for 232 consecutive trading days
The baseline of panic
Over the course of a typical stock market correction, volatility, sentiment, and price-based indicators generally follow a repeatable pattern. Volatility surges, sentiment indicators reflect pessimism and price-based measures become oversold.
One measure of expected volatility, the CBOE Volatility Index (VIX), increased to the highest level in the previous 11 months.
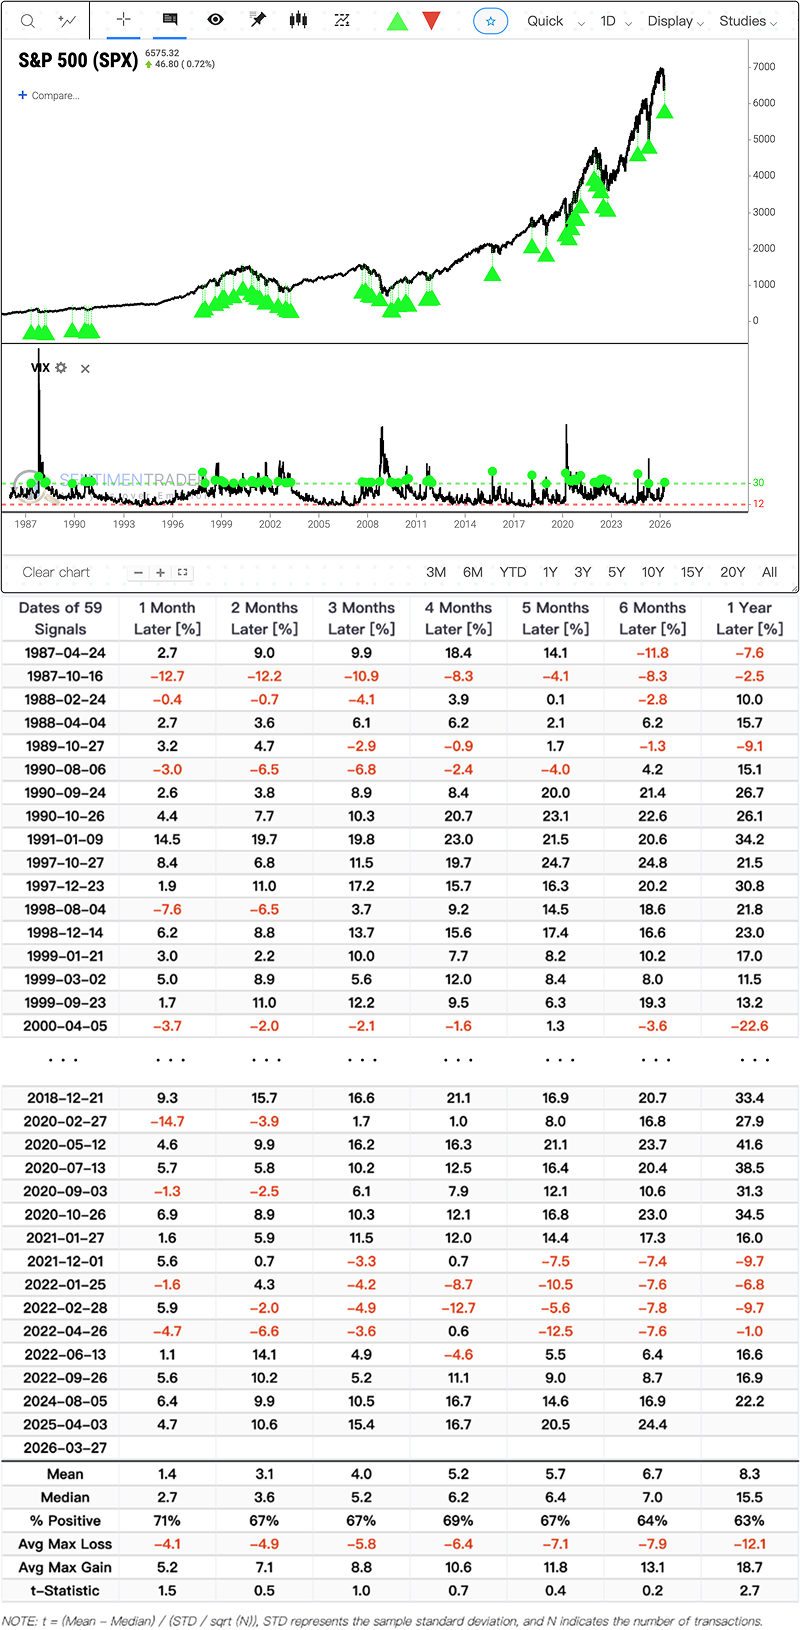
A VIX move above 30 forces systematic hedging programs and dealer gamma desks to react. Historically, such absolute panic, if taken in isolation, has favored buyers.
Looking out 1 month, the S&P 500 was higher 71% of the time.Click here.
Consistently below 30
At the same time, the index just ended a 232-day streak below the 30 level. Data shows t