
The breakout in the 10-year Treasury yield suggests rates are going higher

Key points:
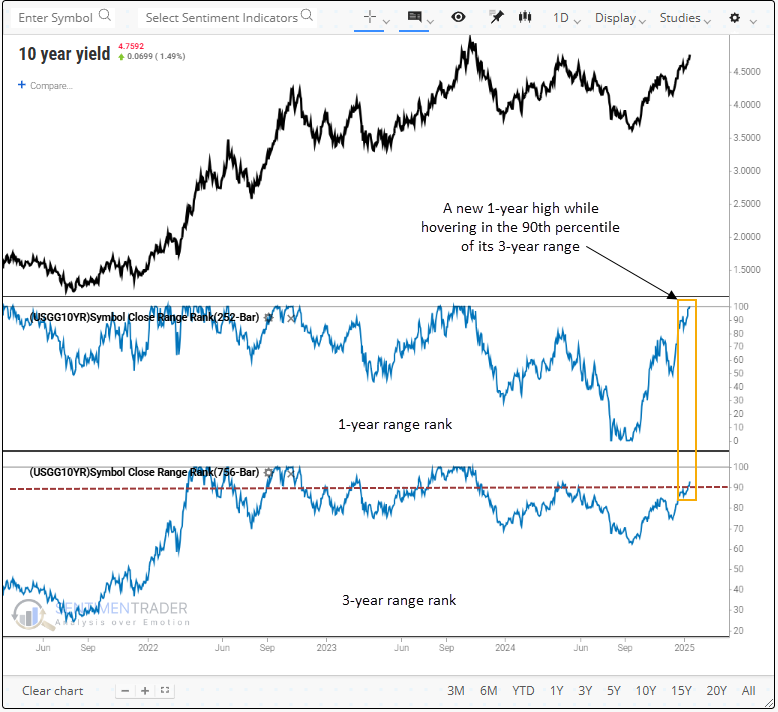
- The 10-year Treasury yield reached a new 1-year high while hovering near the upper end of its 3-year range
- Similar breakouts suggest the benchmark yield could increase over the subsequent two months
- The Dollar index rallied as the S&P 500, Russell 2000, Nasdaq Composite and gold struggled
Are interest rates signaling another temper tantrum for stocks
Last Friday, the 10-year Treasury yield closed at its highest level in a year and within shouting distance of the top end of its three-year range-a milestone achieved just 18 other times since 1965. This ascent could reverberate across the economy, influencing everything from corporate borrowing costs to consumer mortgages and the massive financing needs of government debt, all of which could shape future growth prospects.
Notably, this is the third occurrence of a breakout in the 10-year yield under these same circumstances since March 2022, a sequence unmatched in frequency since the mid-1970s, signaling a pivotal shift in the behavior of interest rates.
In the aftermath of the previous signal, August 2023, the 10-year yield advanced 46 bps over two months, exerting pressure on stocks, with the S&P 500 declining 10% to its October low. Will history rhyme?
To screen out repeats, I required the one-year range rank to fall below the 50th percentile before another signal could trigger.
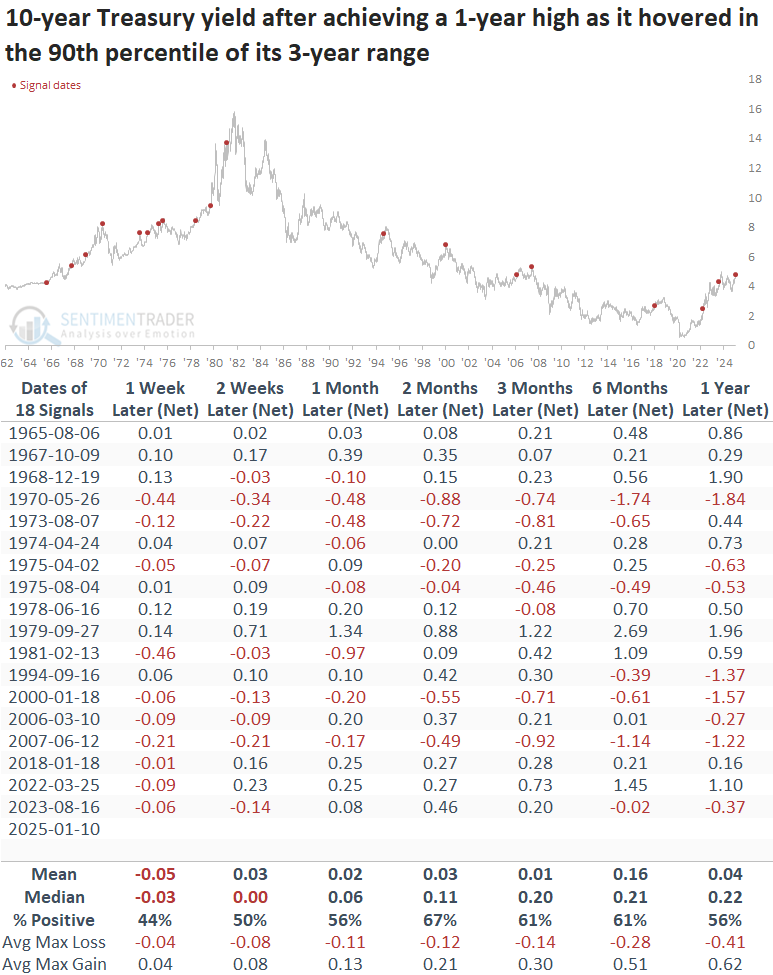
Comparable breakouts in the 10-year Treasury suggest yields could drift higher
Whenever the 10-year Treasury yield reached a new one-year high while remaining in the 90th percentile or above its three-year range, it advanced over the following two months 67% of the time. Since the secular peak in yields in 1981, this pattern resulted in higher yields in 5 of 7 instances, a remarkable scenario given the declining rate environment.
What about stocks?
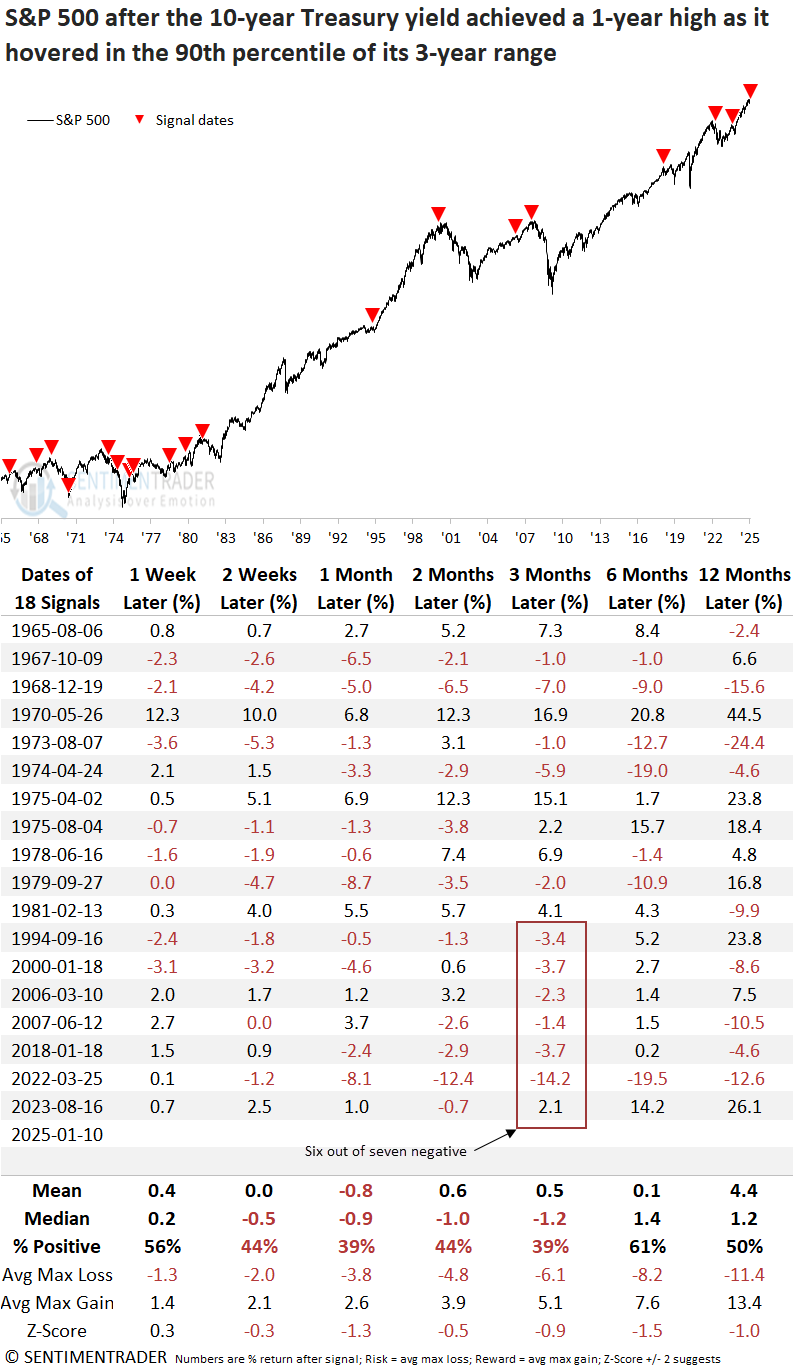
Rising rates have often acted as a headwind for the S&P 500, with pressure becoming apparent two to twelve weeks later. The index declined in six out of seven cases over the following three months since the 1981 yield peak. Furthermore, risk/reward was poor across all time frames, especially from one to six months later.
Other assets
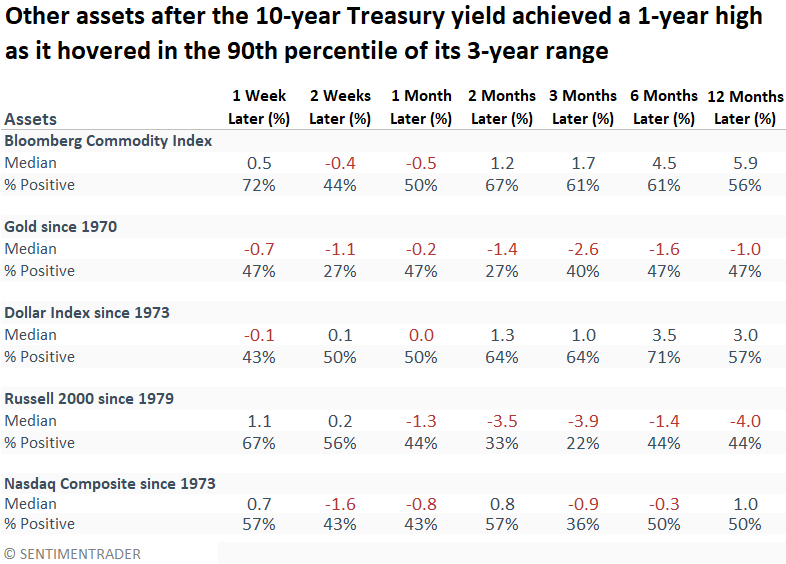
Other stock indexes experienced a similar downturn as the S&P 500, particularly small-cap stocks, which declined 78% of the time over the subsequent three months. Meanwhile, the Dollar Index (DXY) strengthened, likely contributing to tightening financial conditions. This weighed on gold, which remained weak. Notably, the Bloomberg spot commodity index partially defied the trend, likely because many signals originated during the 1960s and 70s, a period marked by favorable trends for commodities.
What the research tells us...
The 10-year Treasury yield closed at a new one-year high as it approached the upper end of its three-year range. Similar breakouts have resulted in a further rise in rates over the next few months. Should history rhyme, the benchmark yield could test the October 2023 high of around 4.91%. A prolonged move above this threshold could trigger significant pressure on risk assets, potentially affecting stocks in a way similar to the last 10% correction or even worse. However, it's important to note that navigating trading ranges is challenging. Given the current oversold condition, if yields rise and retreat (a false breakout), stocks could experience a notable rebound.