
The bond market's historic bout of selling pressure

Key points:
- Bond prices rose despite high inflation readings, a mild positive sign for bonds
- Sentiment is atrocious toward fixed income, enough to signal good opportunities for buyers
- The biggest issue is history, with limited data before 1990
A market that doesn't do what it should...
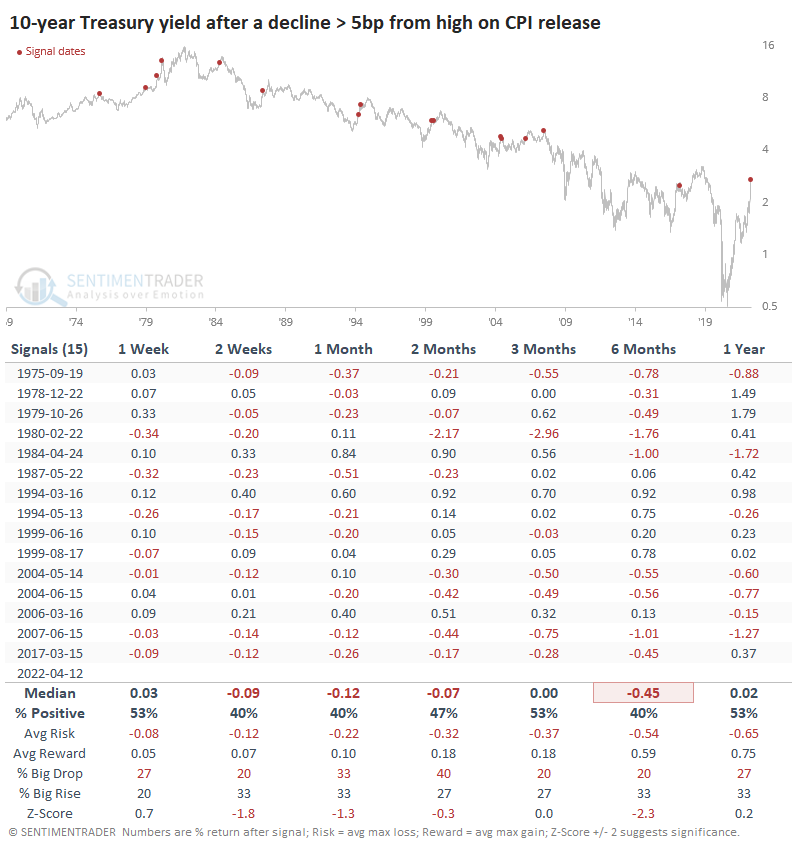
When a market doesn't do what it's supposed to do, it usually pays to pay attention. Some were surprised by yesterday's move in bonds, given the red-hot CPI release showing little slowdown in inflation. The yield on 10-year Treasuries backed up by more than five basis points, relaxing from what had been a 52-week high.
The table below shows returns in 10-year Treasury yields (in basis points) after yields had been at a 52-week high within the past week, then declined by at least five b.p. on a day that the CPI report was released. Yields typically slid further in the weeks ahead, even during the 1970s.
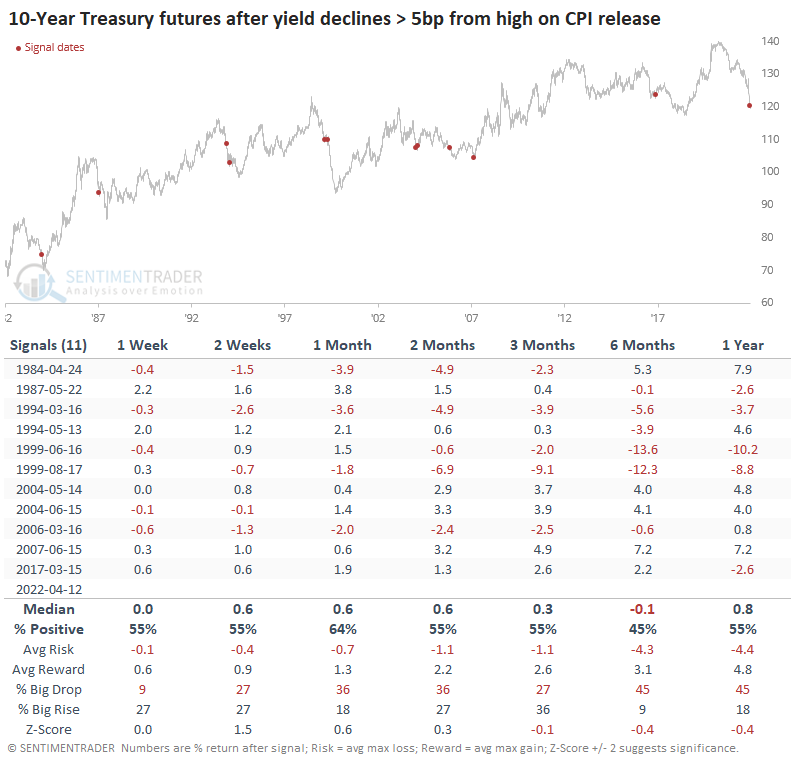
Since the inception of 10-year Treasury futures in 1982, those prices typically rebounded in the weeks ahead, but it wasn't a strong edge.
Bond investors are pessimistic and selling heavily
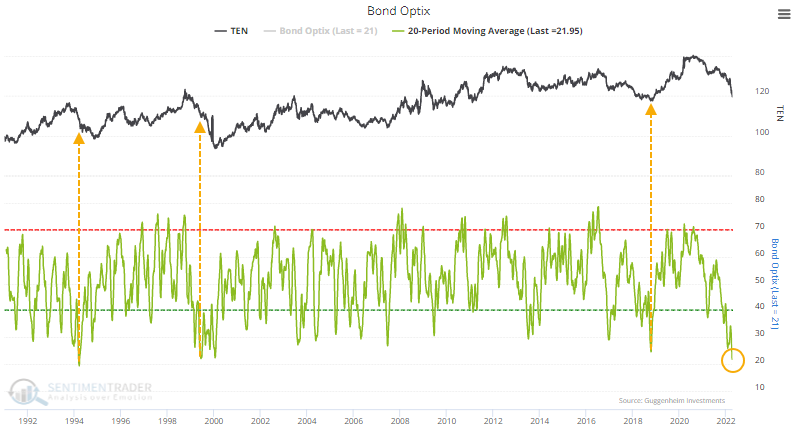
Sentiment toward bonds has been atrocious. Over the past 20 days, the Bond Optimism Index has averaged less than 22%, one of the lowest readings in 30 years. Two of the last three readings, however, led to more selling pressure before significant rebounds.
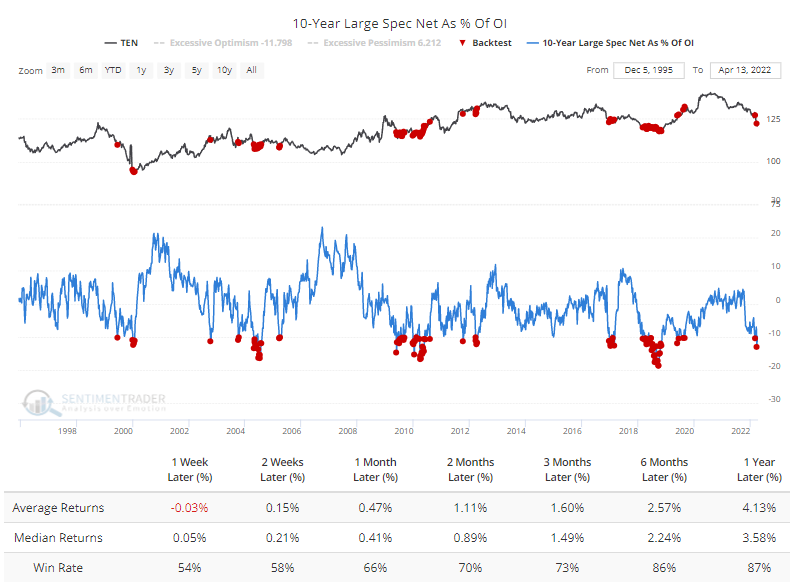
One of the inputs to the Optimism Index is positioning in the futures market. Speculators in 10-year Treasury futures hold more than 10% of open interest net short, after which the Backtest Engine shows excellent returns in 10-year notes.
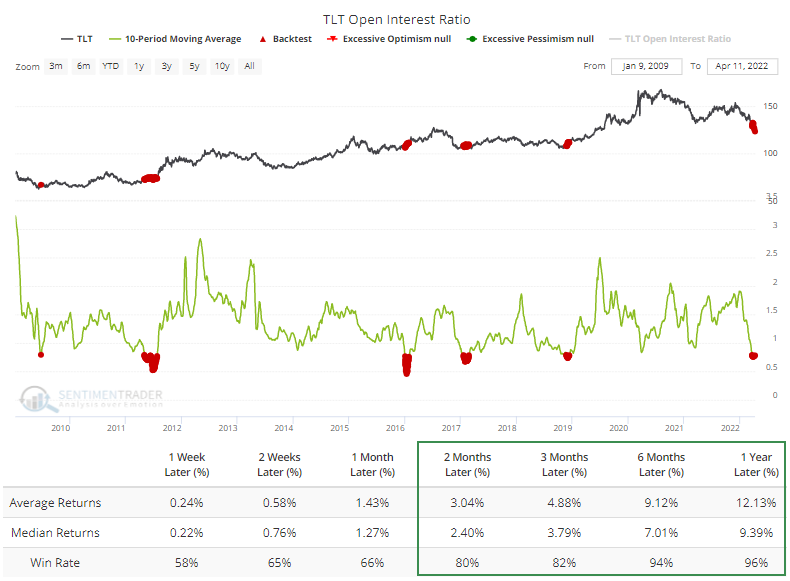
The ratio of outstanding put options to call options in the TLT fund has plunged. This is typically not a contrary indicator - low relative levels of put open interest have led to positive forward returns per the Backtest Engine. The chart below zooms in on the last decade to more easily see this relationship; returns in the table are for the entire history.
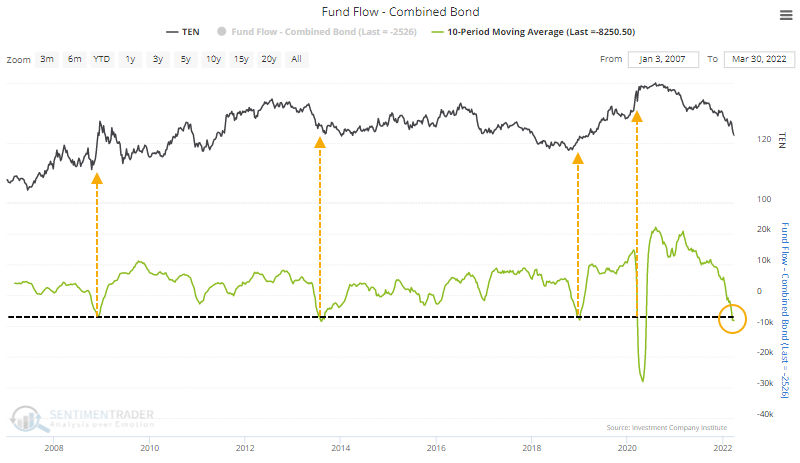
Flows in bond ETFs and mutual funds have been pathetic, with an average outflow of more than $8 billion per week over the past ten weeks. Fund flows during the height of the pandemic fears were weird, but other than that, massive outflows led to significant gains in bonds.
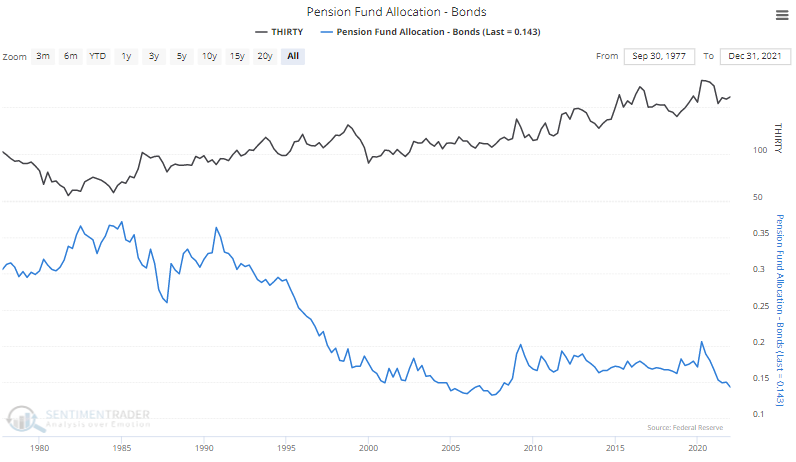
Allocations to bonds appear light, with pension funds close to a 40-year low in exposure.
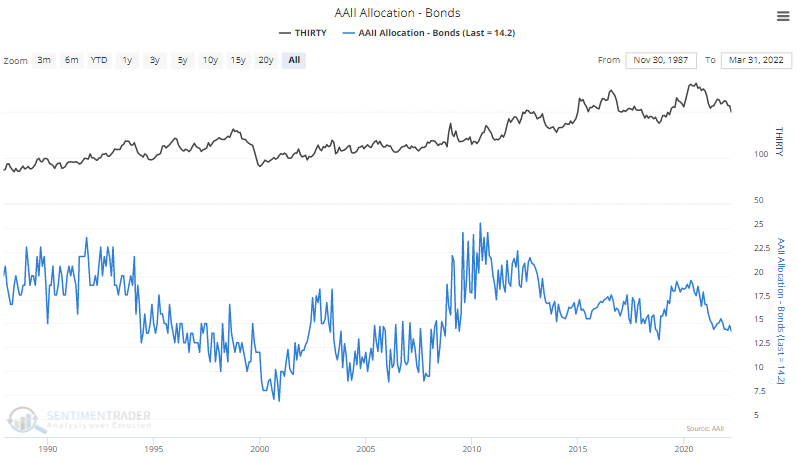
Self-reported exposure among individual investors in the AAII survey is about the lowest in more than a decade, but it was consistently lower in the early 2000s.
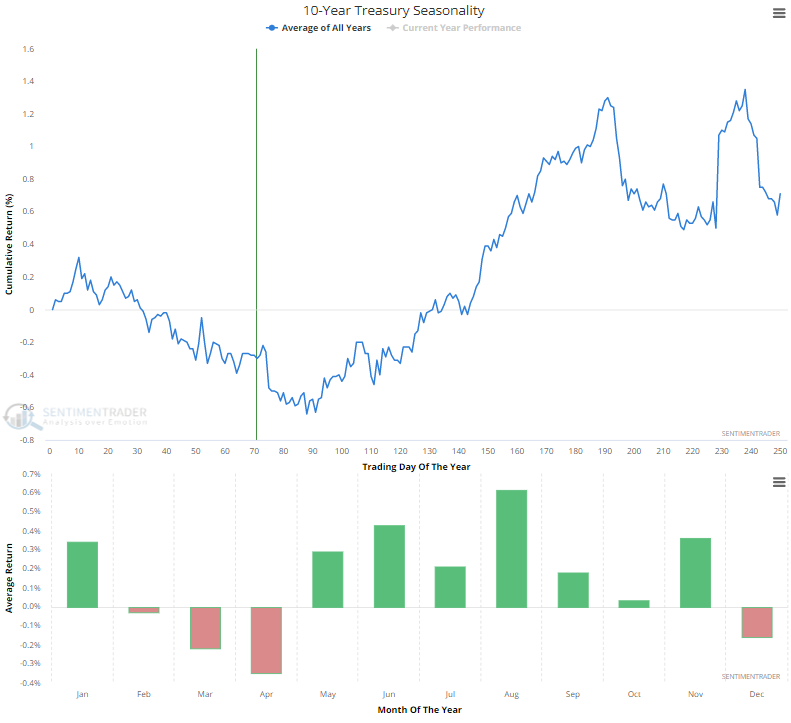
The calendar is still a bit of a headwind for bond prices. The seasonal window for 10-year Treasuries remains weak through April, after which it turns highly positive.
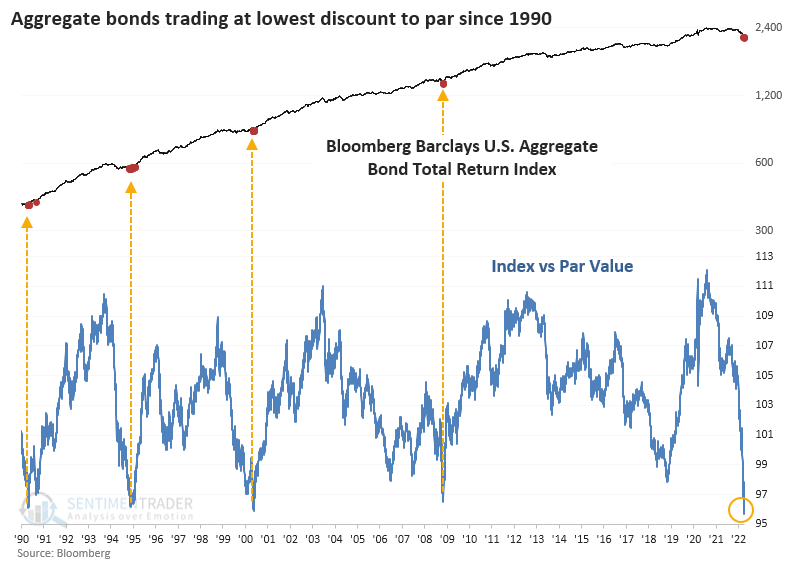
It's not just Treasuries that have suffered. In recent weeks, we've noted several times the pressure being faced in corporate bonds, as well, especially high-yield. According to Bloomberg calculations, the average bond in the U.S. is now trading at a near-record discount to par value. It just barely exceeded this in May 2000.
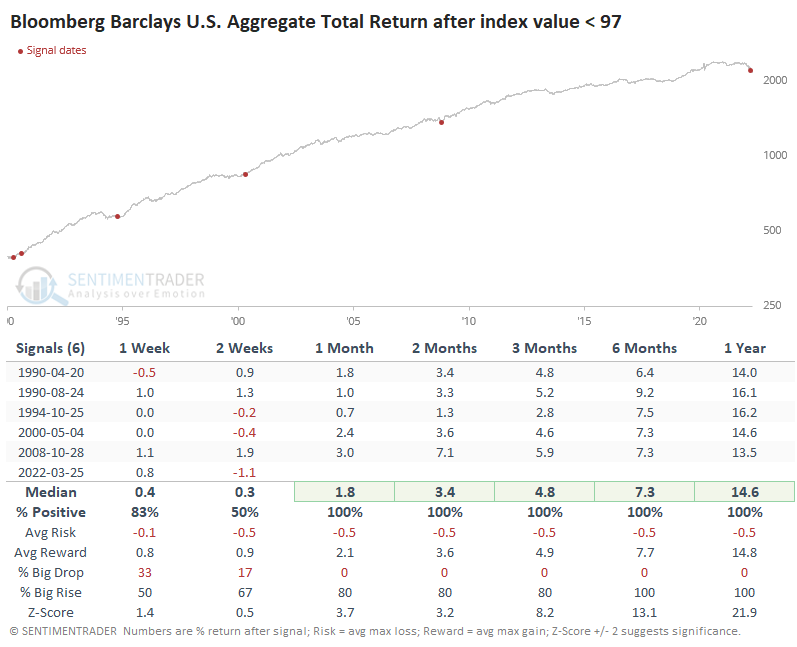
Every time it dropped below $97, the aggregate index total return averaged at least 13% during the following year.
What the research tells us...
Over the past several months, there has been no shortage of extremes in the bond market. The price action that the market has suffered has many hallmarks of forced selling, and we won't find out the horror stories among leveraged investors until after the fact. During the bond market carnage of 1994, when Orange County, California went bankrupt, forced selling in Treasuries and other bonds occurred until news broke that they went toes-up. Investors feared the bond market would collapse at that point, but that's when it bottomed.
More and more factors are lining up for at least a medium-term rebound in bond prices. Any historical comparison to the past 30 years suggests now is a reasonable risk/reward opportunity to add exposure to that market. The most challenging aspect of this is limited history - during the 1970s, similar setups would have likely led to more losses.