
The big picture for the bond market - Part III

Key Points
- The 45-month cycle will turn favorable on May 1st and will remain so for 22 months
- The annual seasonal trend will turn up at the close on May 12th and remains favorable through September 1st
- The bond market tends to perform well when both of these seasonal factors are favorable
The big picture - the 45-month cycle
In Part II, I highlighted the 45-month cycle in treasury bonds and the fact that a new cycle is beginning on May 1st. The chart below displays the cumulative % total return for the Bloomberg Barclays Long-term Treasury Index held only during the first 22 months of each cycle since 1973.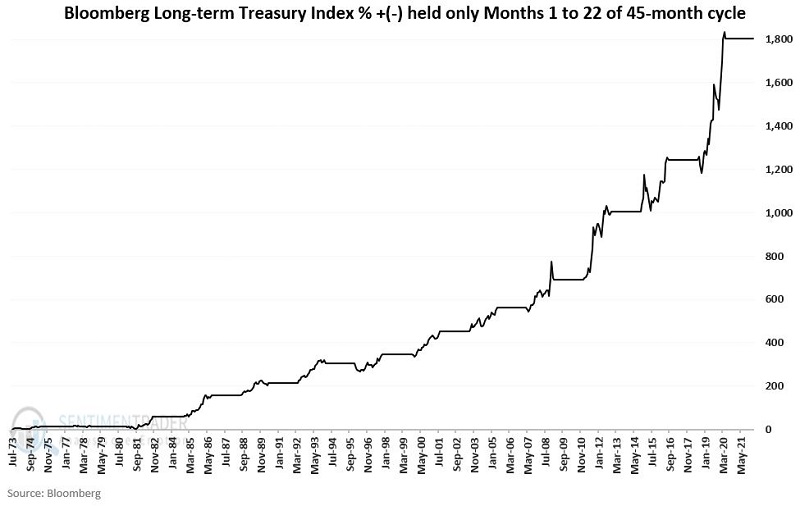
The big picture - the annual seasonal trend
The chart below displays the annual seasonal trend for the 30-year treasury bond. Note that a favorable period begins on TDY (Trading Day of Year) #91 and runs through TDY # 169.
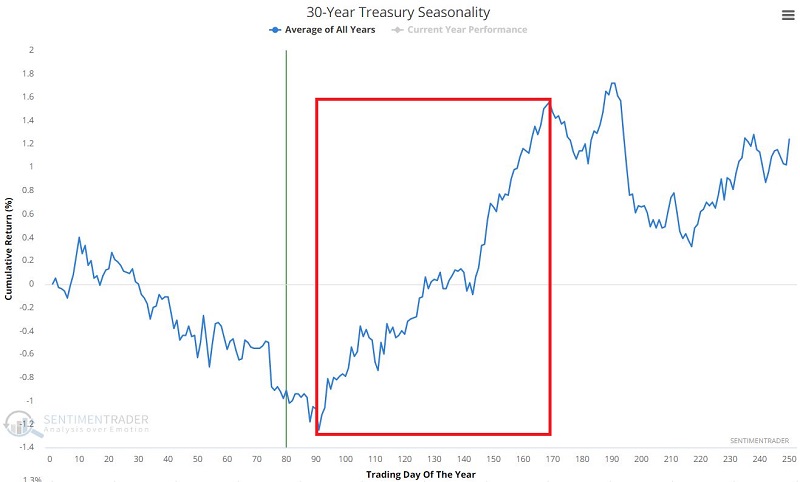
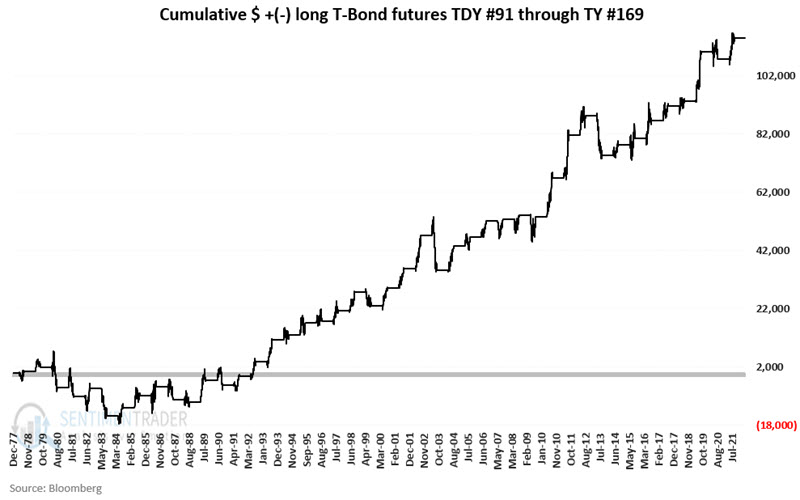
For 2022 this period begins at the close on May 12th and remains favorable through September 1st. The chart below displays the cumulative hypothetical $ gain achieved by holding a long position in t-bond futures (1 point in price movement = $1,000 change in contract value) only during this favorable period every year since 1978.
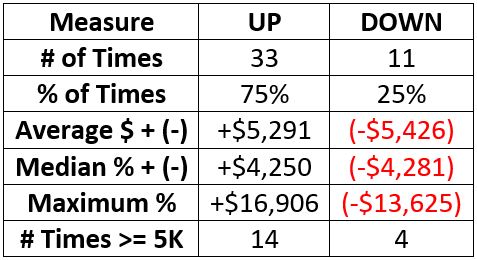
The table below displays a summary of performance during this period.
As detailed in Part I, the caveat is that the general nature of the trend in interest rates may be changing from a falling to a rising rate environment. This could serve to mute performance.
Combining 45-month and annual seasonal trend
Let's run the following test:
A = If the 45-month cycle is Favorable, then +2 points else 0 points
B = If TDY is > 91 and <= 169 then +1 point else 0 points
Combined Model = A + B
The Combined Model can equal +3, +2, +1, or 0 points at the end of each trading day.
Combined Model = +3
The Combined Model will be at +3 from the close on 5/12/2022 through the close on 9/1/2022. The chart below displays the hypothetical cumulative $ growth from a long position in t-bonds futures held only when both:
- The 45-month cycle is favorable, and;
- The TDY is between 92 and 169
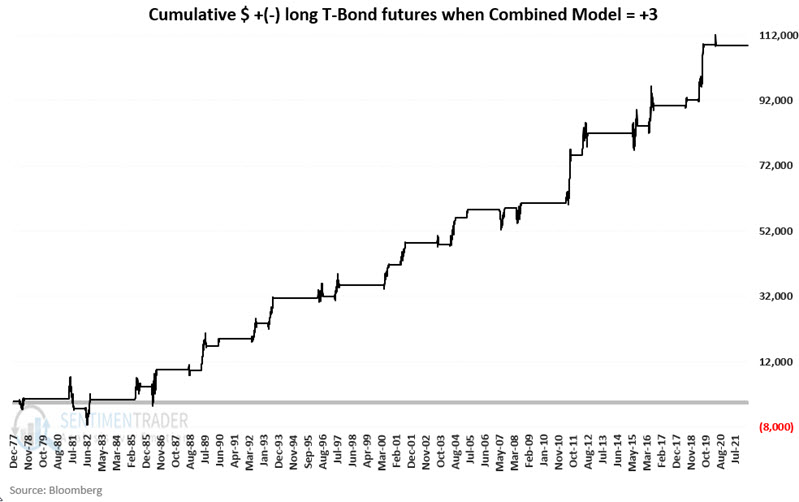
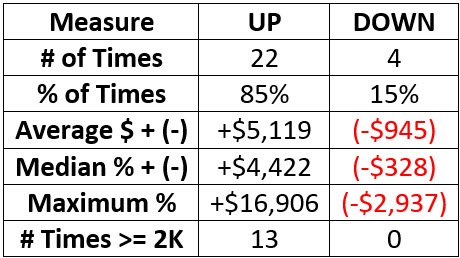
The table below summarizes t-bond futures performance when the Combined Model = +3.
Combined Model = +2
The chart below displays the hypothetical cumulative $ growth from a long position in t-bonds futures held only when:
- The 45-month cycle is favorable
- BUT The TDY is NOT between 92 and 169
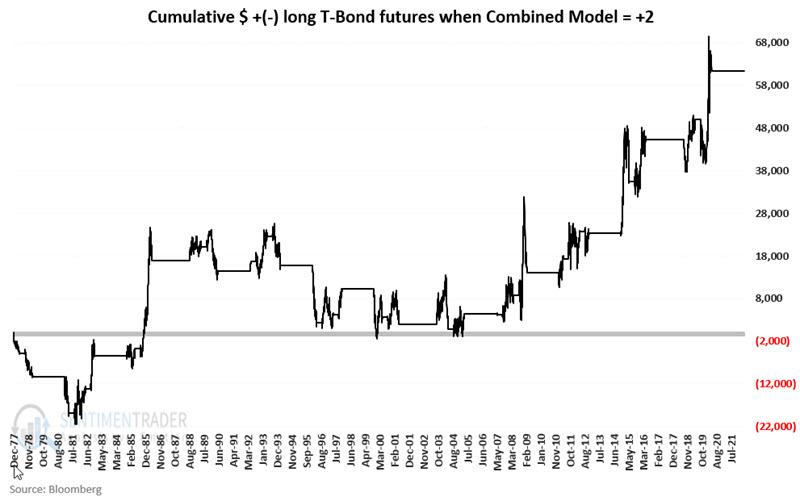
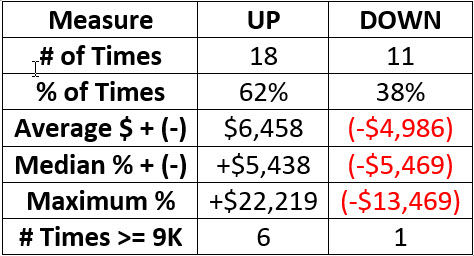
The table below summarizes t-bond futures performance when the Combined Model = +2.
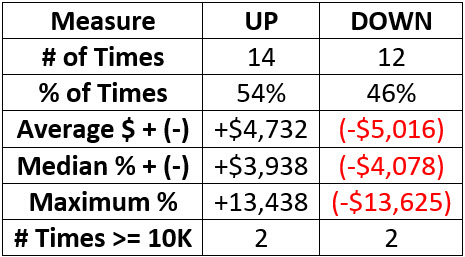
Combined Model = +1
The chart below displays the hypothetical cumulative $ growth from a long position in t-bonds futures held only when:
- The TDY is between 92 and 169
- BUT the 45-month cycle is unfavorable
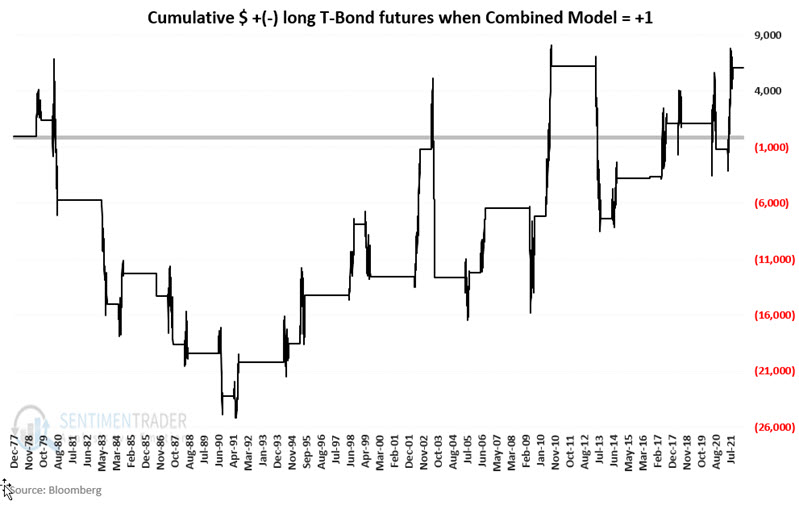
The table below summarizes t-bond futures performance when the Combined Model = +1.
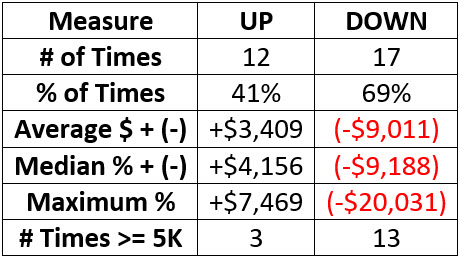
Combined Model = 0
To fully illustrate the importance of these two cycles, the chart below displays the hypothetical cumulative $ growth from a long position in t-bonds futures held only when:
- BOTH the 45-month cycle is unfavorable and;
- The TDY is NOT between 92 and 169
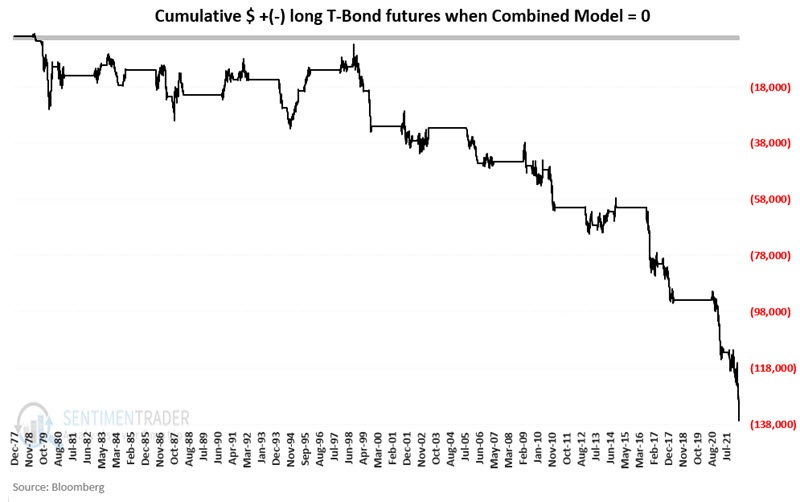
The table below summarizes t-bond futures performance when the Combined Model = 0.
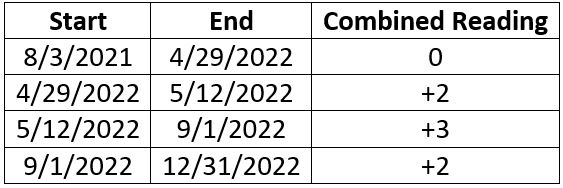
Combined Model for the rest of 2022
The table below displays the readings for the Combined Model detailed above for the rest of 2022.
What the research tells us...
The bond market tends to perform well when the 45-month cycle is favorable (starting May 1st) and the annual seasonal trend is in the favorable Trading Day of Year #91 and TDY #169 period. Such a favorable period begins at the close on 5/12/2022 and extends through 9/1/2022. That said, given the potential change in the interest rate environment from falling to rising, any favorable results in the months ahead may be muted compared to results achieved during the nearly four-decade decline in interest rates.
The bottom line for the bond market is to hope for the best and prepare for the worst.