
The big picture for the bond market - Part II

Key Points
- Based on trend-following indicators, interest rates may be in the early stages of a long-term rising trend (a negative for bond prices)
- Trend-following indicators are always vulnerable to "whipsaws" and quick reversals
- Price action, breadth, and sentiment indicators suggest the bond market is extremely oversold and due for a bounce
- Likewise, on a contrarian basis, note that a key cycle for treasury bonds will flip from unfavorable to favorable at the end of April 2022
In Part I, I detailed the apparent change in the long-term trend of interest rates from declining to rising. As long as this trend remains, an overall challenging environment will persist for bond prices. On a more optimistic note, a key cycle in the bond market is about to turn favorable.
One cyclical factor that will soon favor bonds
For at least the last 50 years, treasury bond prices have exhibited a trend within a 45-month cycle:
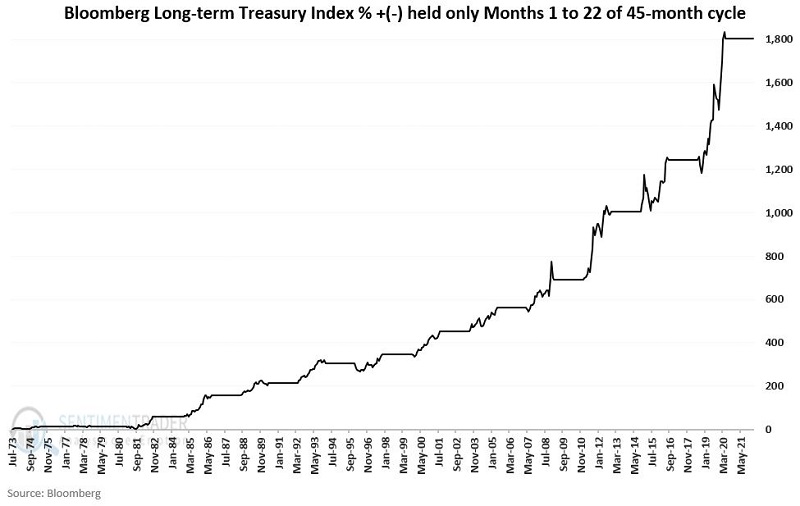
- The first 22 months of the cycle are considered "favorable"
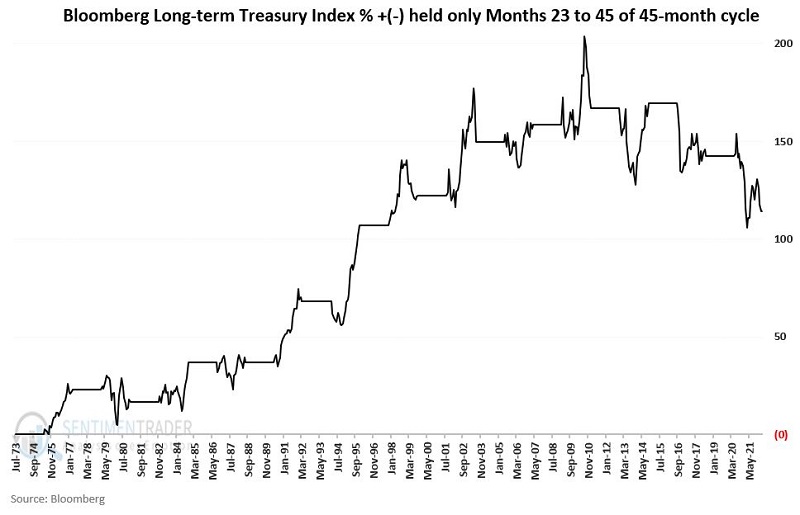
- The last 23 months of the cycle are considered "less favorable"
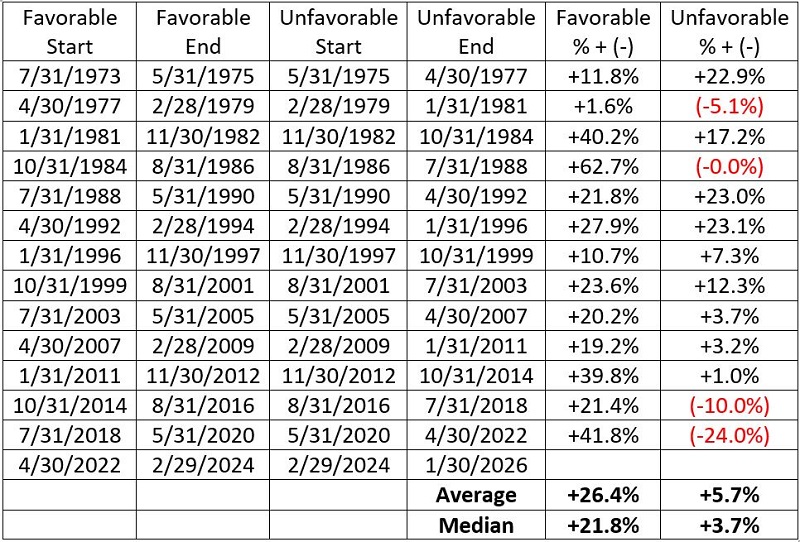
The first 45-month cycle we will consider started on 7/31/1973. The "favorable" 22-month period extended through 5/31/1975. The "less favorable" 23-month period then extended through 4/30/1977, at which point the cycle began again.
The most recent cycle:
- Began on 7/31/2018
- The favorable portion of this cycle ended on 5/31/2020, with the Bloomberg Long Treasury Index showing a gain of +41.8%
- From 5/31/2020 through 4/22/2022, the Bloomberg Long Treasury Index has declined roughly -24%
- The good news (hopefully) is that this cycle will begin again at the close on 4/29/2022
Historical results
The chart below displays the cumulative total % return achieved by the Bloomberg Barclays Long Treasury Index if held only during each cycle's first 22 favorable months since 1973. The cumulative total return through March 2022 is +1,803%.
The chart below displays the cumulative total % return achieved by the Bloomberg Barclays Long Treasury Index if held only during each cycle's last 23 less favorable months since 1973. The cumulative total return through March 2022 is +103%. Through 4/22/2022, that number is down to roughly +84% (not shown in the chart below).
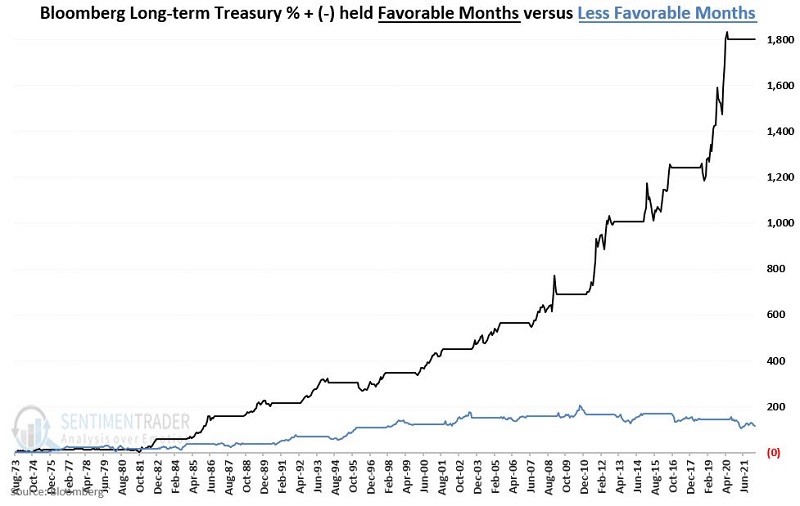
The two charts above are combined in the chart below to put the comparative results into perspective.
The table below displays the total % return for the Bloomberg Barclays Long Treasury Index during each favorable and unfavorable period since 1973.
What the research tells us...
Given the recent apparent trend change for interest rates, investors may need to adjust their attitude regarding how bonds fit into their portfolios. Nevertheless, a bear market in bonds is not guaranteed. With the treasury bond 45-month cycle shifting back to "favorable," there is reason to believe that the worst may be over and that opportunities will exist in the bond market - particularly for shorter-term bond traders.