Products
SentimenTrader Trading Tools
‍
Backtest Engine
My Trading Toolkit
Correlation Analysis
Seasonality
Market Prediction
Indicators & Data API
‍
Proprietary Indicators & Charts
Market Data API
Strategies & Scanner
‍
50+ Trading Strategies
Smart Stock Scanner
Smart Option Scanner
Research Reports
‍
Research Solutions
Reports Library
Free Resources
Simple Backtest Calculator
Simple Seasonality Calculator
The Kelly Criterion Calculator
Sentiment Geo Map
Public Research Reports
Education
Sentiment Indicators
Technical Indicators
Pricing
Company
About
In the News
Testimonials
Client Success Stories
Contact
Log inLoginSign up
< BACK TO ALL REPORTS

The Big Money has left the stock market

Jason Goepfert
2022-04-25
The latest survey of Big Money by Barron's shows that large money managers are extremely pessimistic about the prospect for stocks. This is not a contrary indicator, as the S&P 500's worst returns tended to occur when these managers were pessimistic.

Key points:

  • A semi-annual poll of large money managers shows that they are pessimistic on stocks
  • This is the 2nd-lowest bullish reading in the survey's 23-year history
  • Stocks tend to perform much better when these managers are optimistic

The Big Money is fleeing stocks again

The latest semi-annual poll of large money managers from Barron's showed a sharp drop in bulls. The survey represents the attitudes of hundreds of managers with influence over hundreds of billions of dollars under management.

While half of them were optimistic about the prospects for stocks last October, only a third of them are now. That's the 2nd-lowest percentage of bulls in the survey's history, next to October 2019, when only 27% of managers were bullish.

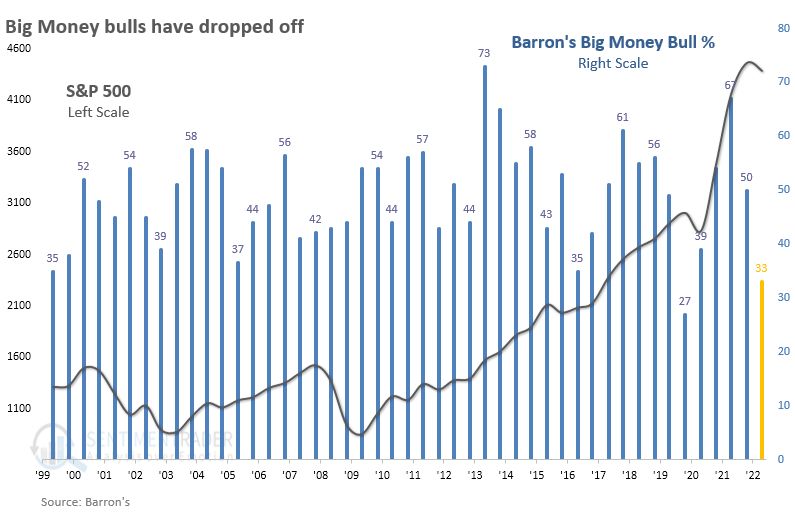
Even though they're not optimistic, they still expect the S&P 500 to gain nearly 9% from mid-April through December. That's par for the course - they almost always expect the S&P to gain about 7% over the next six months.

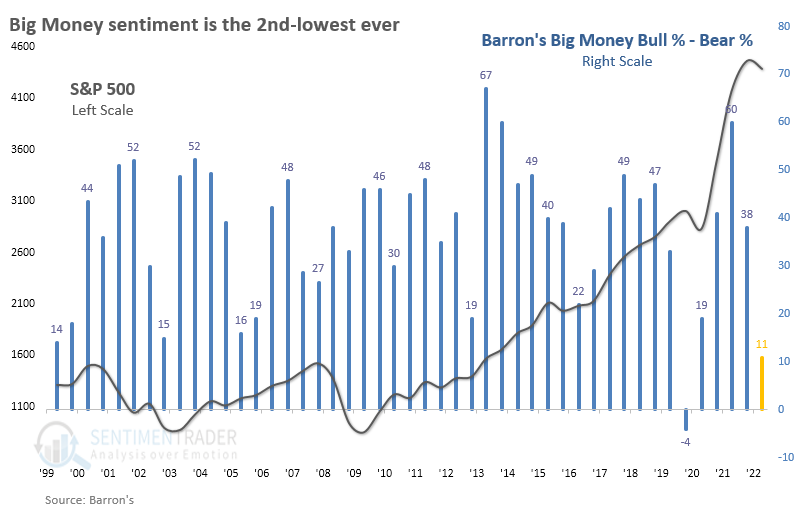
The percentage of bears rose, so the net difference between bullish and bearish managers plunged from +38% to only +11%, again the 2nd-lowest reading in 23 years.

We've looked at this survey many times over the years, concluding that the managers can be a slight contrary indicator at extremes, but it's not a decisive edge. While some of the market's better long-term returns came after depressed sentiment, the S&P 500 performed better when managers were bullish and worse when they were bearish.

The table below shows the S&P's returns from one survey to the next, about six months apart. The first three columns show the survey dates with the lowest percentage of bullish managers, and the next three show the dates with the most bullish.

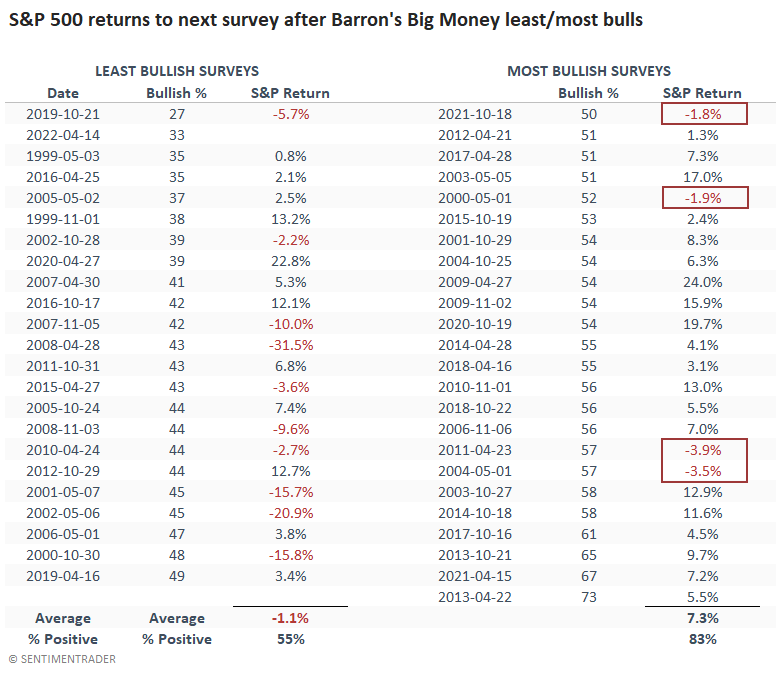
There was a clear difference in overall performance during the next half-year. When fewer than half of managers were optimistic, the S&P 500 returned an average of -1.1% and showed a positive return 55% of the time. The worst losses came when managers were not inclined to step in and buy.

But when more than half of managers were bullish, the index jumped an average of +7.3%, with 83% of periods showing a positive return. Most notably, the losses were small, none more than -4%.

What the research tells us...

Investors always seem to have a knee-jerk contrarian response to any survey of other investors. Maybe it's an inherent need to feel superior to others, even though the vast majority are trend-followers when actually putting money to work. People want to feel superior, but they need to be comforted by a crowd. When it comes to the kinds of large money managers surveyed by Barron's, there is compelling evidence that we should avoid this tendency in ourselves and not take their current pessimism as a sign that we should feel more optimistic. Quite the opposite, in fact. If those with influence over such large piles of money do not feel inclined to buy the dip, then stocks tend to struggle much more than when those people are feeling better about things. Add this to the pile of recent headwinds.

PRODUCTS
SentimenTrader
Trading Tools
Indicators & Data API
‍
Strategies & Scanner
‍
Research Reports
FREE
RESOUrCES
Simple Backtest
Calculator
Simple Seasonality
Calculator
The Kelly Criterion
Calculator
Sentiment Geo Map
‍
Public Research Reports
‍
Education
Sentiment Indicators
‍
Technical Indicators
‍
Pricing
Bundle pricing
‍
FAQ
‍
Announcements
‍
COMPANY
‍
About
‍
In the News
‍
Testimonials
‍
Client Success Stories
CONTACT
‍
General Inquiries
‍
Media Inquiries
‍
Financial Professionals Inquiries
‍
© 2026 Sundial Capital Research Inc. All rights reserved.
Setsail Marketing
TermsPrivacyAffiliate Program
Risk Disclosure: The information and tools provided are for research and analytical purposes only and are not intended as investment advice. Market analysis involves uncertainty, and outcomes may differ from expectations. Users should conduct their own due diligence and consider their individual circumstances before making any financial decisions. Past performance is not necessarily indicative of future results.

Hypothetical Performance Disclosure: Hypothetical performance results have many inherent limitations, some of which are described below. No representation is being made that any account will or is likely to achieve profits or losses similar to those shown; in fact, there are frequently sharp differences between hypothetical performance results and the actual results subsequently achieved by any particular trading program. One of the limitations of hypothetical performance results is that they are generally prepared with the benefit of hindsight. In addition, hypothetical trading does not involve financial risk, and no hypothetical trading record can completely account for the impact of financial risk of actual trading. for example, the ability to withstand losses or to adhere to a particular trading program in spite of trading losses are material points which can also adversely affect actual trading results. There are numerous other factors related to the markets in general or to the implementation of any specific trading program which cannot be fully accounted for in the preparation of hypothetical performance results and all which can adversely affect trading results.

Testimonial Disclosure: Testimonials appearing on this website may not be representative of other clients or customers and is not a guarantee of future performance or success.