
The best July since...ever

Key points:
- The S&P 500 has closed at a record high 10 times in July, the 3rd-best July since 1928
- It was even better for the Nasdaq Composite, with a record-shattering 14 highs in July
- After clusters of new highs during a traditionally slow month, August has been a struggle
Bad time to take a vacation
What a year to be an investor. In pretty much anything, at pretty much any time. Even during the dog days of summer.
It's unusual for stocks to record so many multi-year highs in July. With a week left and helped by six straight record closes, the S&P 500 has already carved out a place in history as one of the best Julys ever. Only two other years have witnessed so many highs during a traditionally slow month.
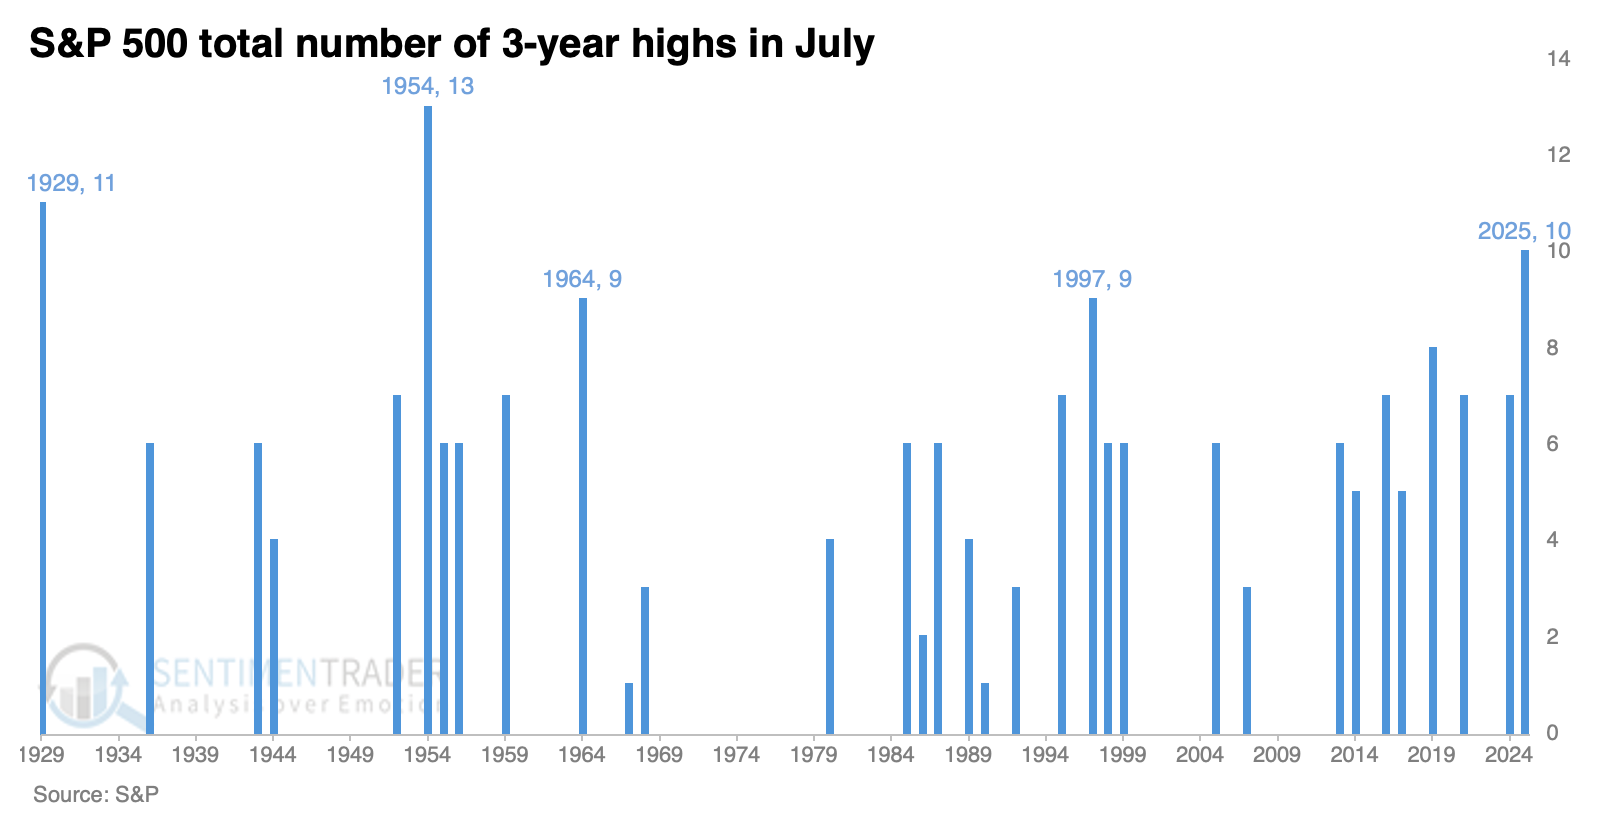
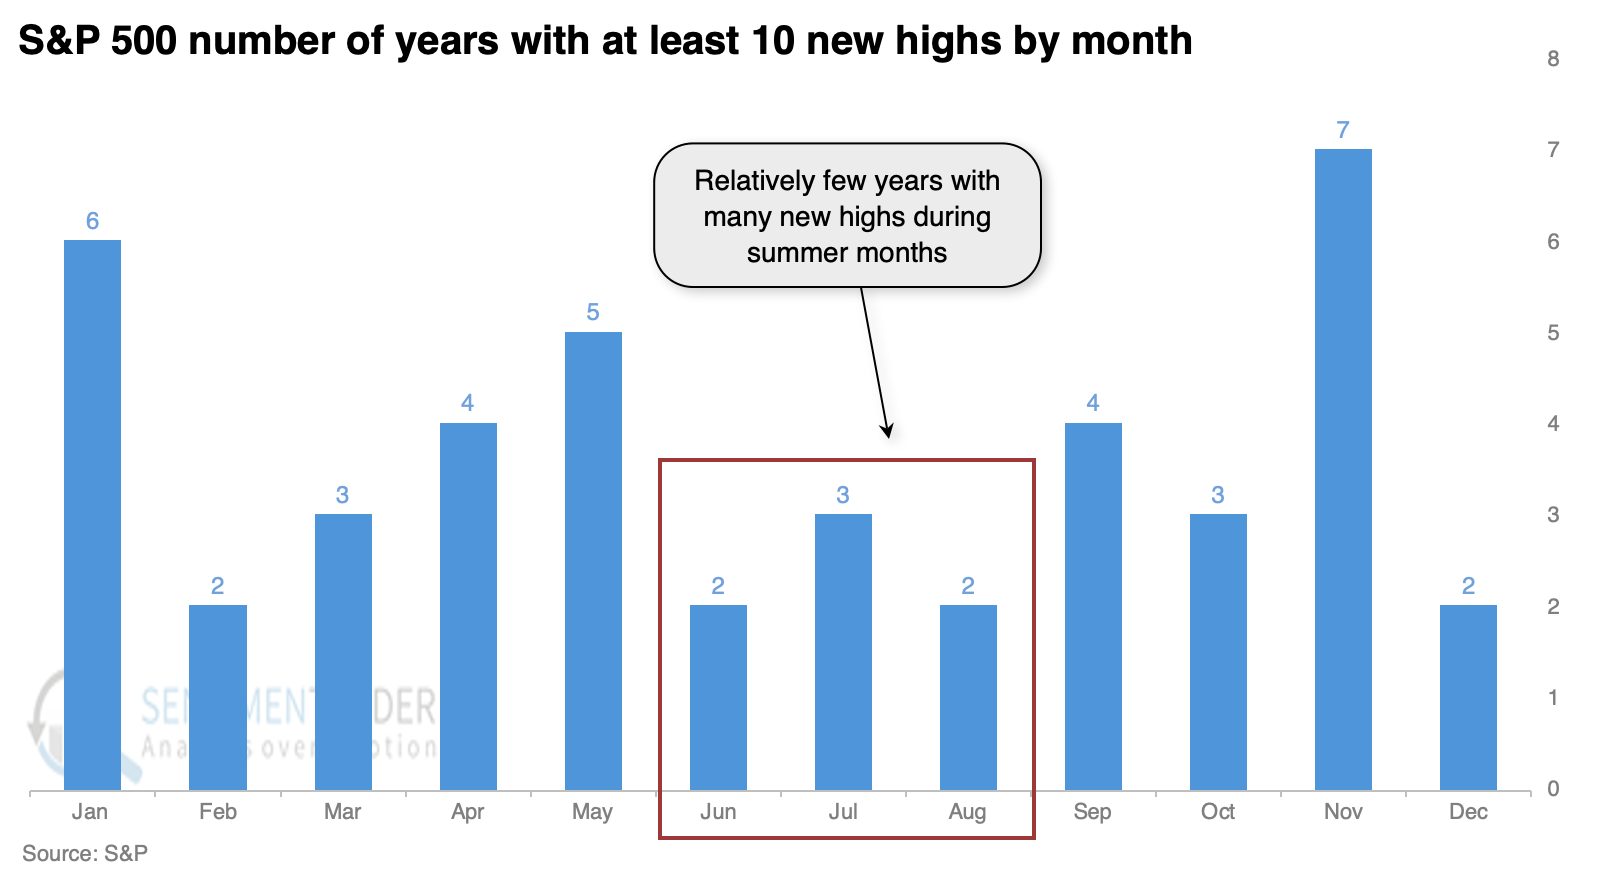
It has been relatively unusual for the S&P to record one of these "super months" during the summer period of June through August. It happened more than twice as often during the three months from November through January.
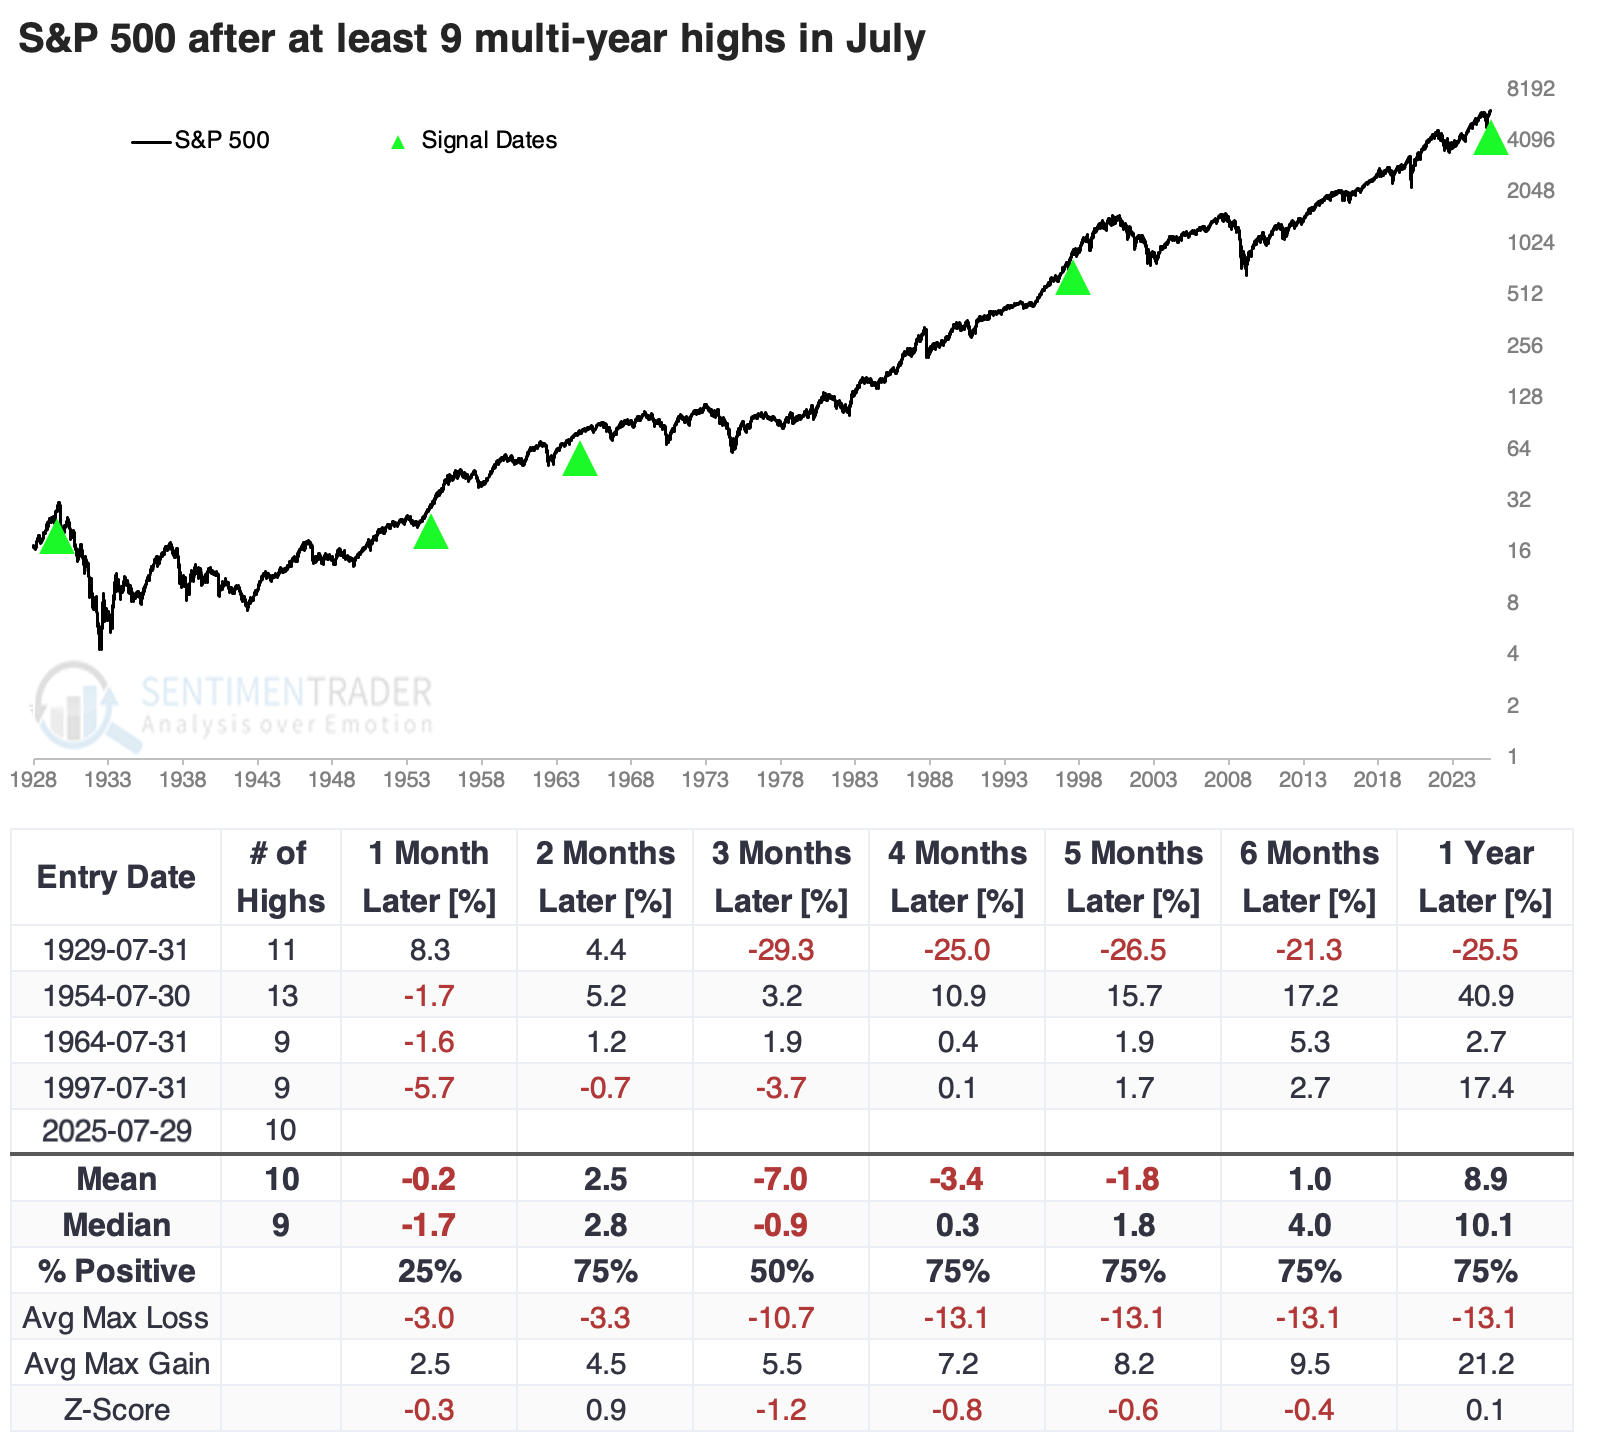
Only two years had ten or more multi-year highs in July, so if we relax that a bit and include years with at least nine, we get a couple more. Not that it cleared up the picture at all, since two showed gains over the next few months, and two showed losses. But three of the four saw the S&P 500 dip in August.
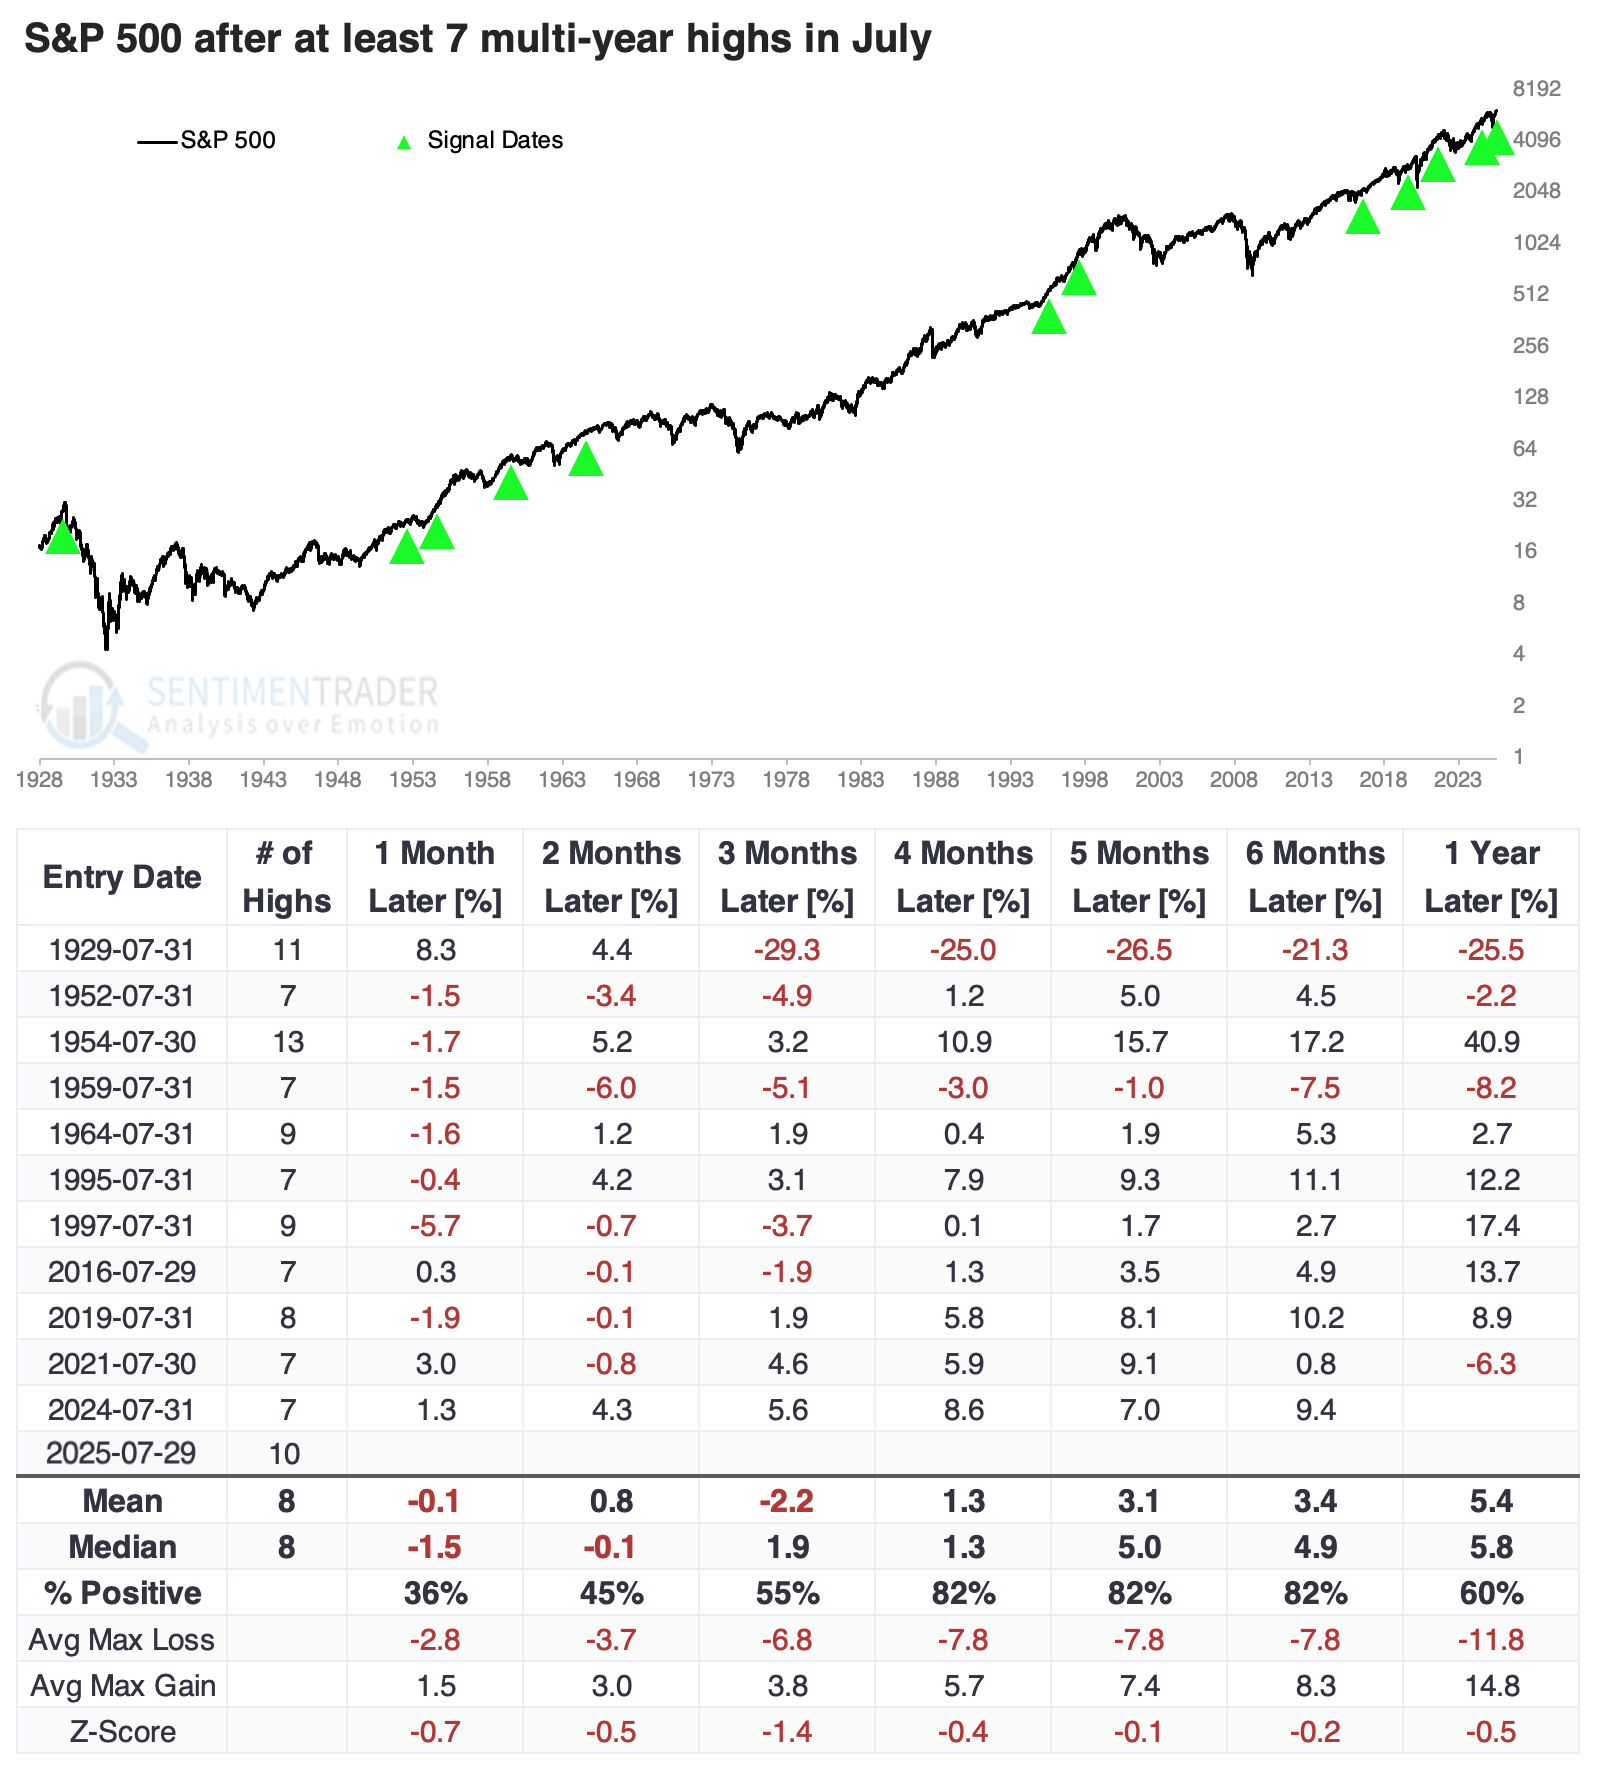
We can increase the sample size by relaxing the threshold further. The table below shows S&P 500 returns after it enjoyed at least seven multi-year highs in July. August continued to be weak, rising only 36% of the time. The next two months were positive less than half the time, with a negative median return and risk/reward ratio.
From four to six months later, the S&P sported a positive return all but two times. However, its average returns were weak, as were the ratios of maximum gains to losses.
The Nasdaq did it better
It's been even better to be an investor in a Nasdaq stock, coming as a shock to exactly nobody. The Composite recorded its 14th high in July, marking this month as the all-time best, bar none.
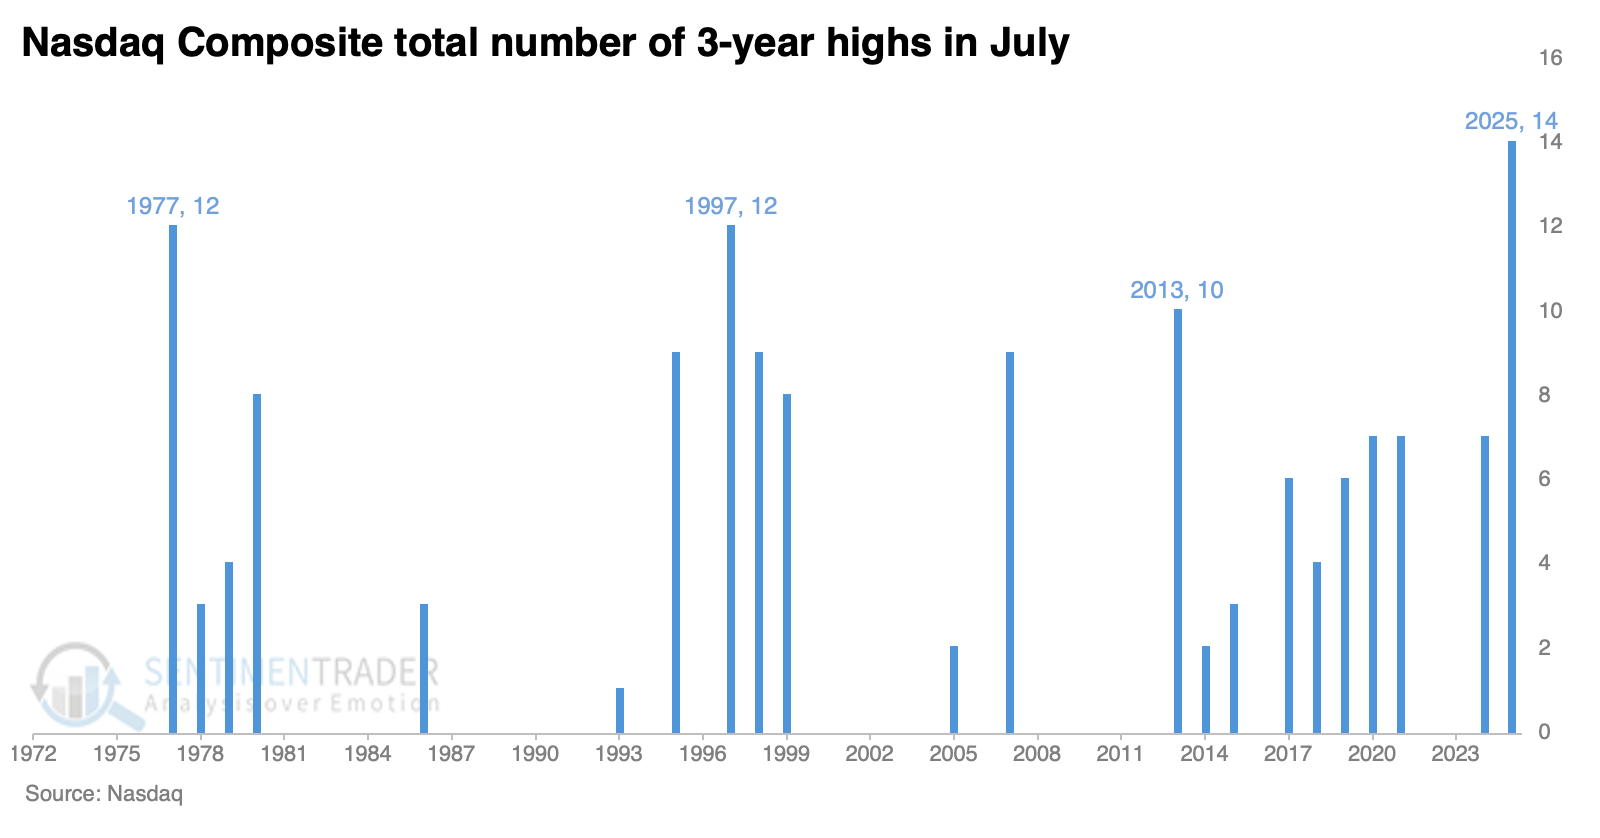
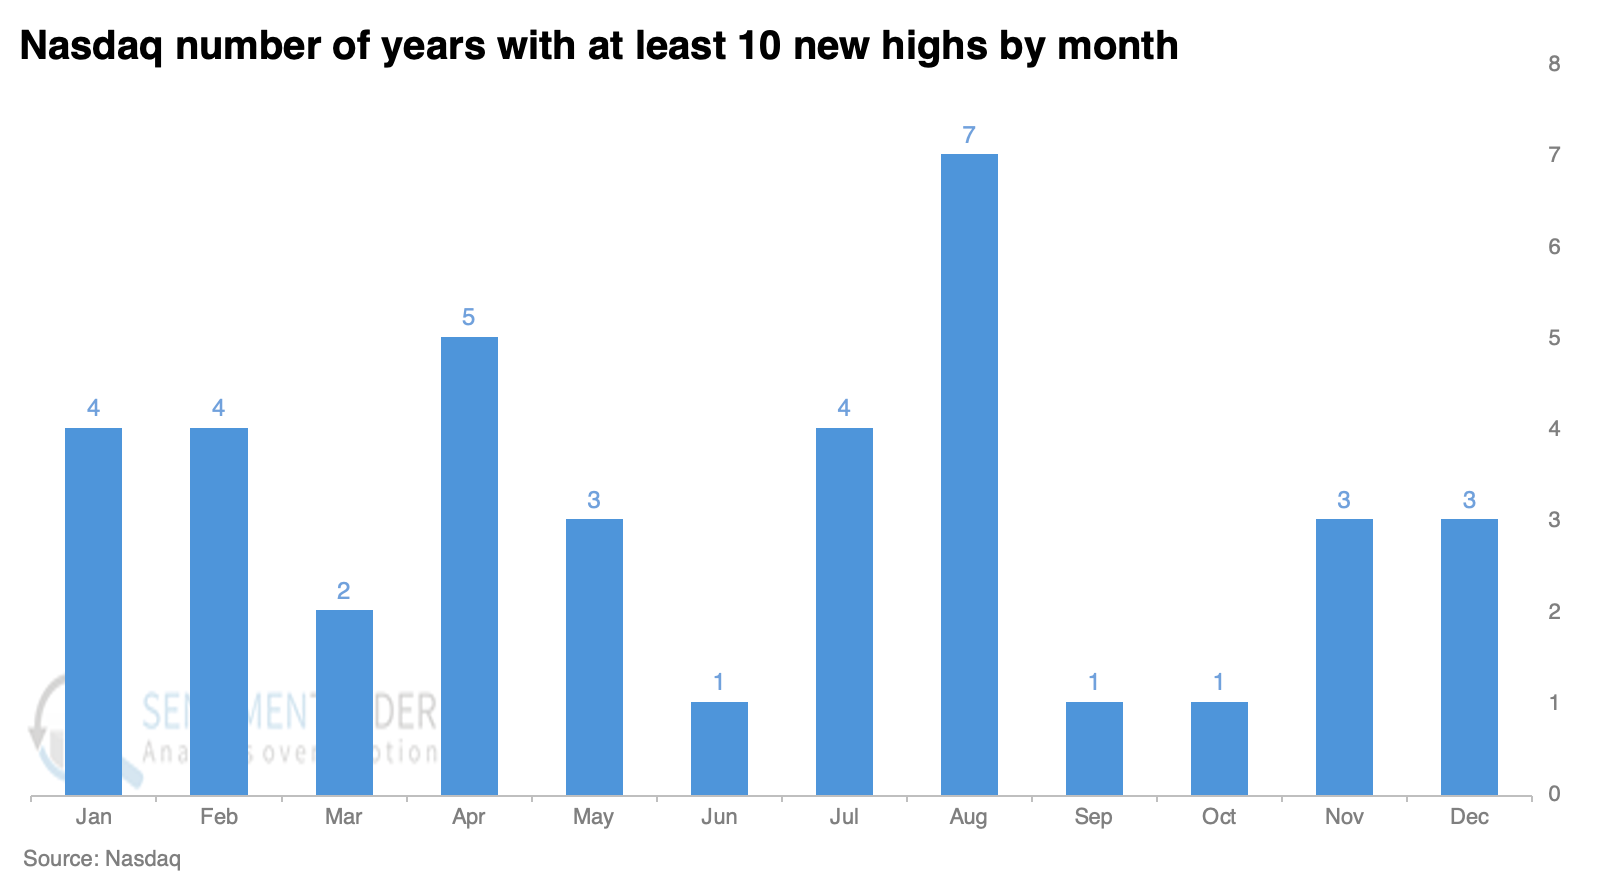
Oddly, it hasn't been as unusual for the Nasdaq to see a super month during this time of year. August saw the most new highs, which is odd compared to the S&P 500. However, all but one occurred before 1994, so there has been only one of these Nasdaq super months in the past 30 years (the post-pandemic melt-up in 2020).
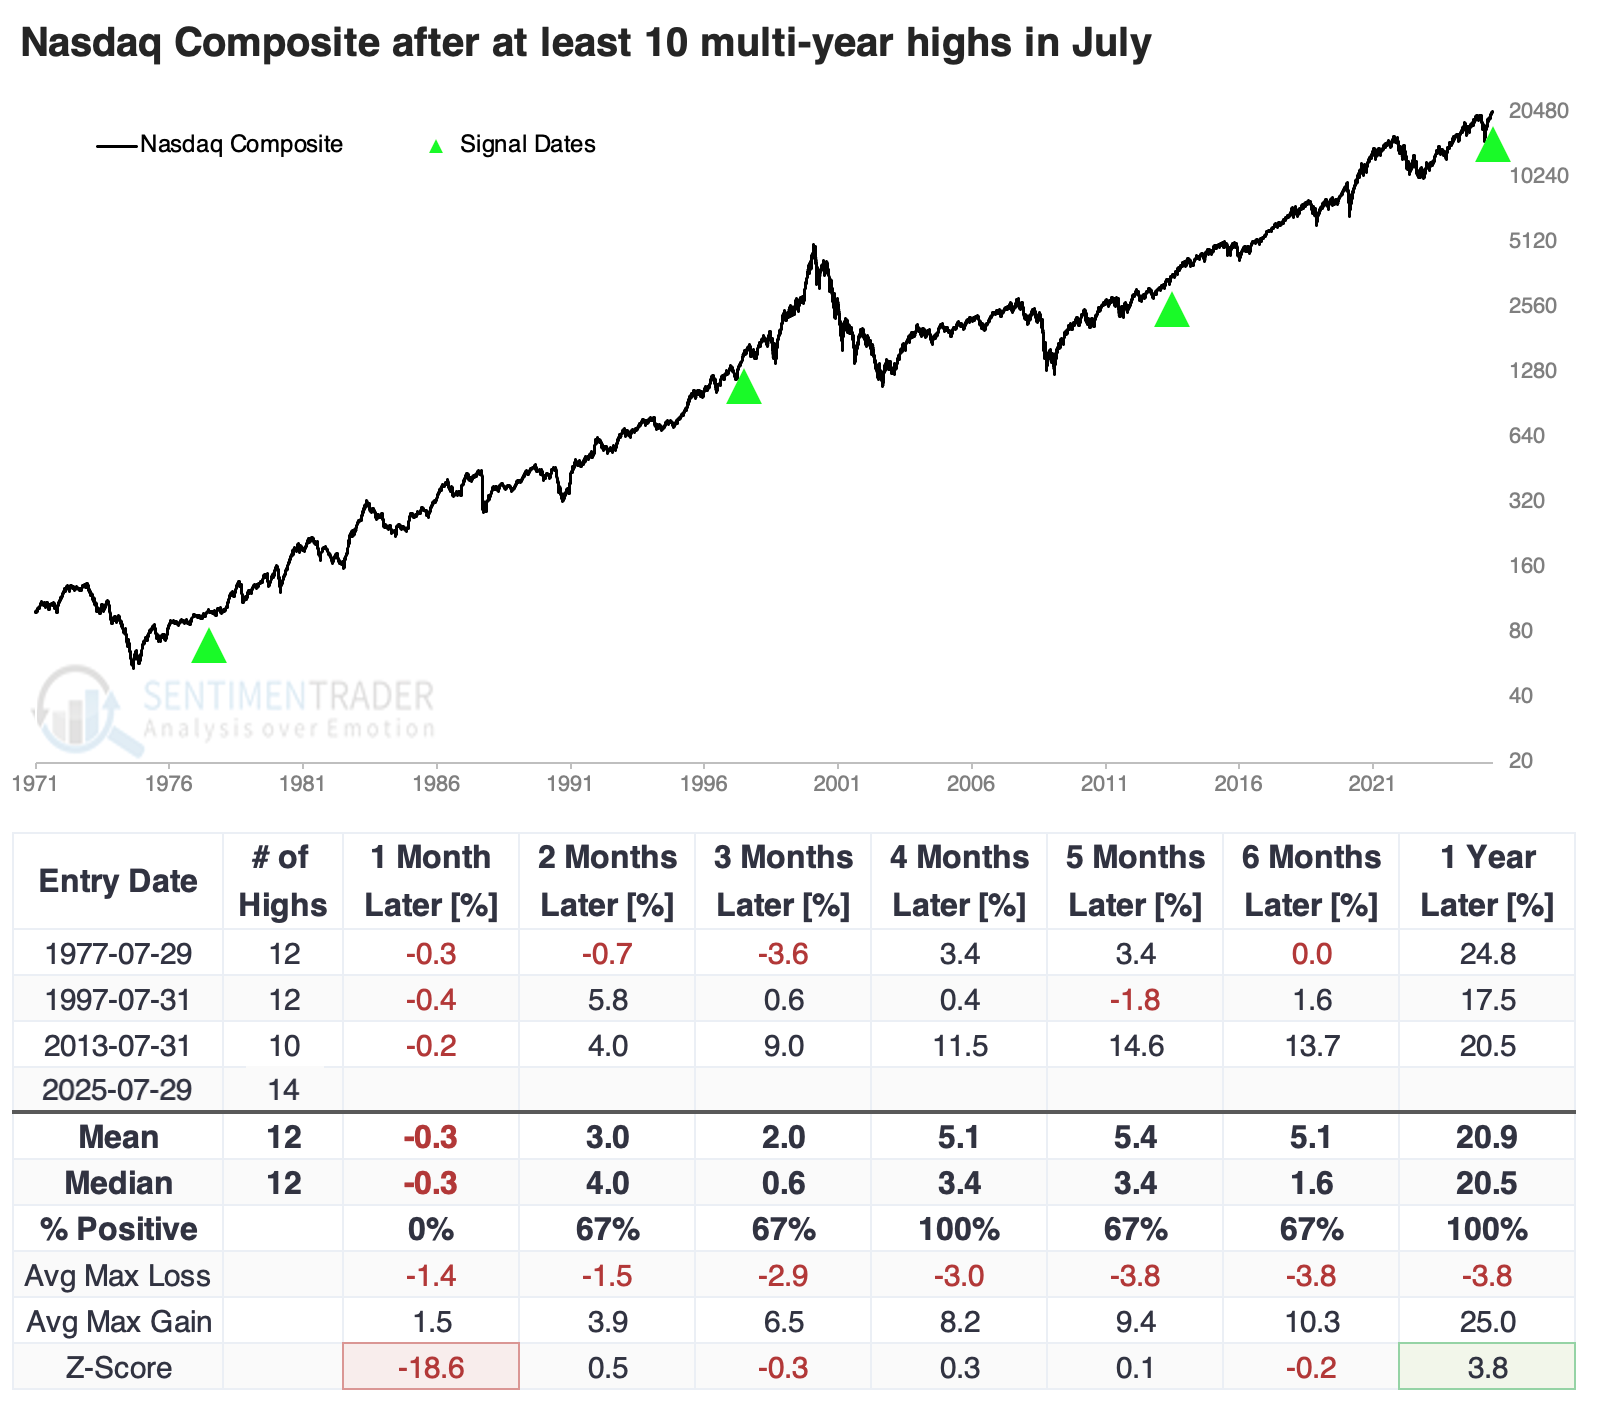
The Nasdaq Composite declined over the following month in the three years when it enjoyed ten or more new highs in July. The losses weren't significant, and two snapped back the month following that. Only 2013 saw the Nasdaq take off to the upside and not look back in the months following.
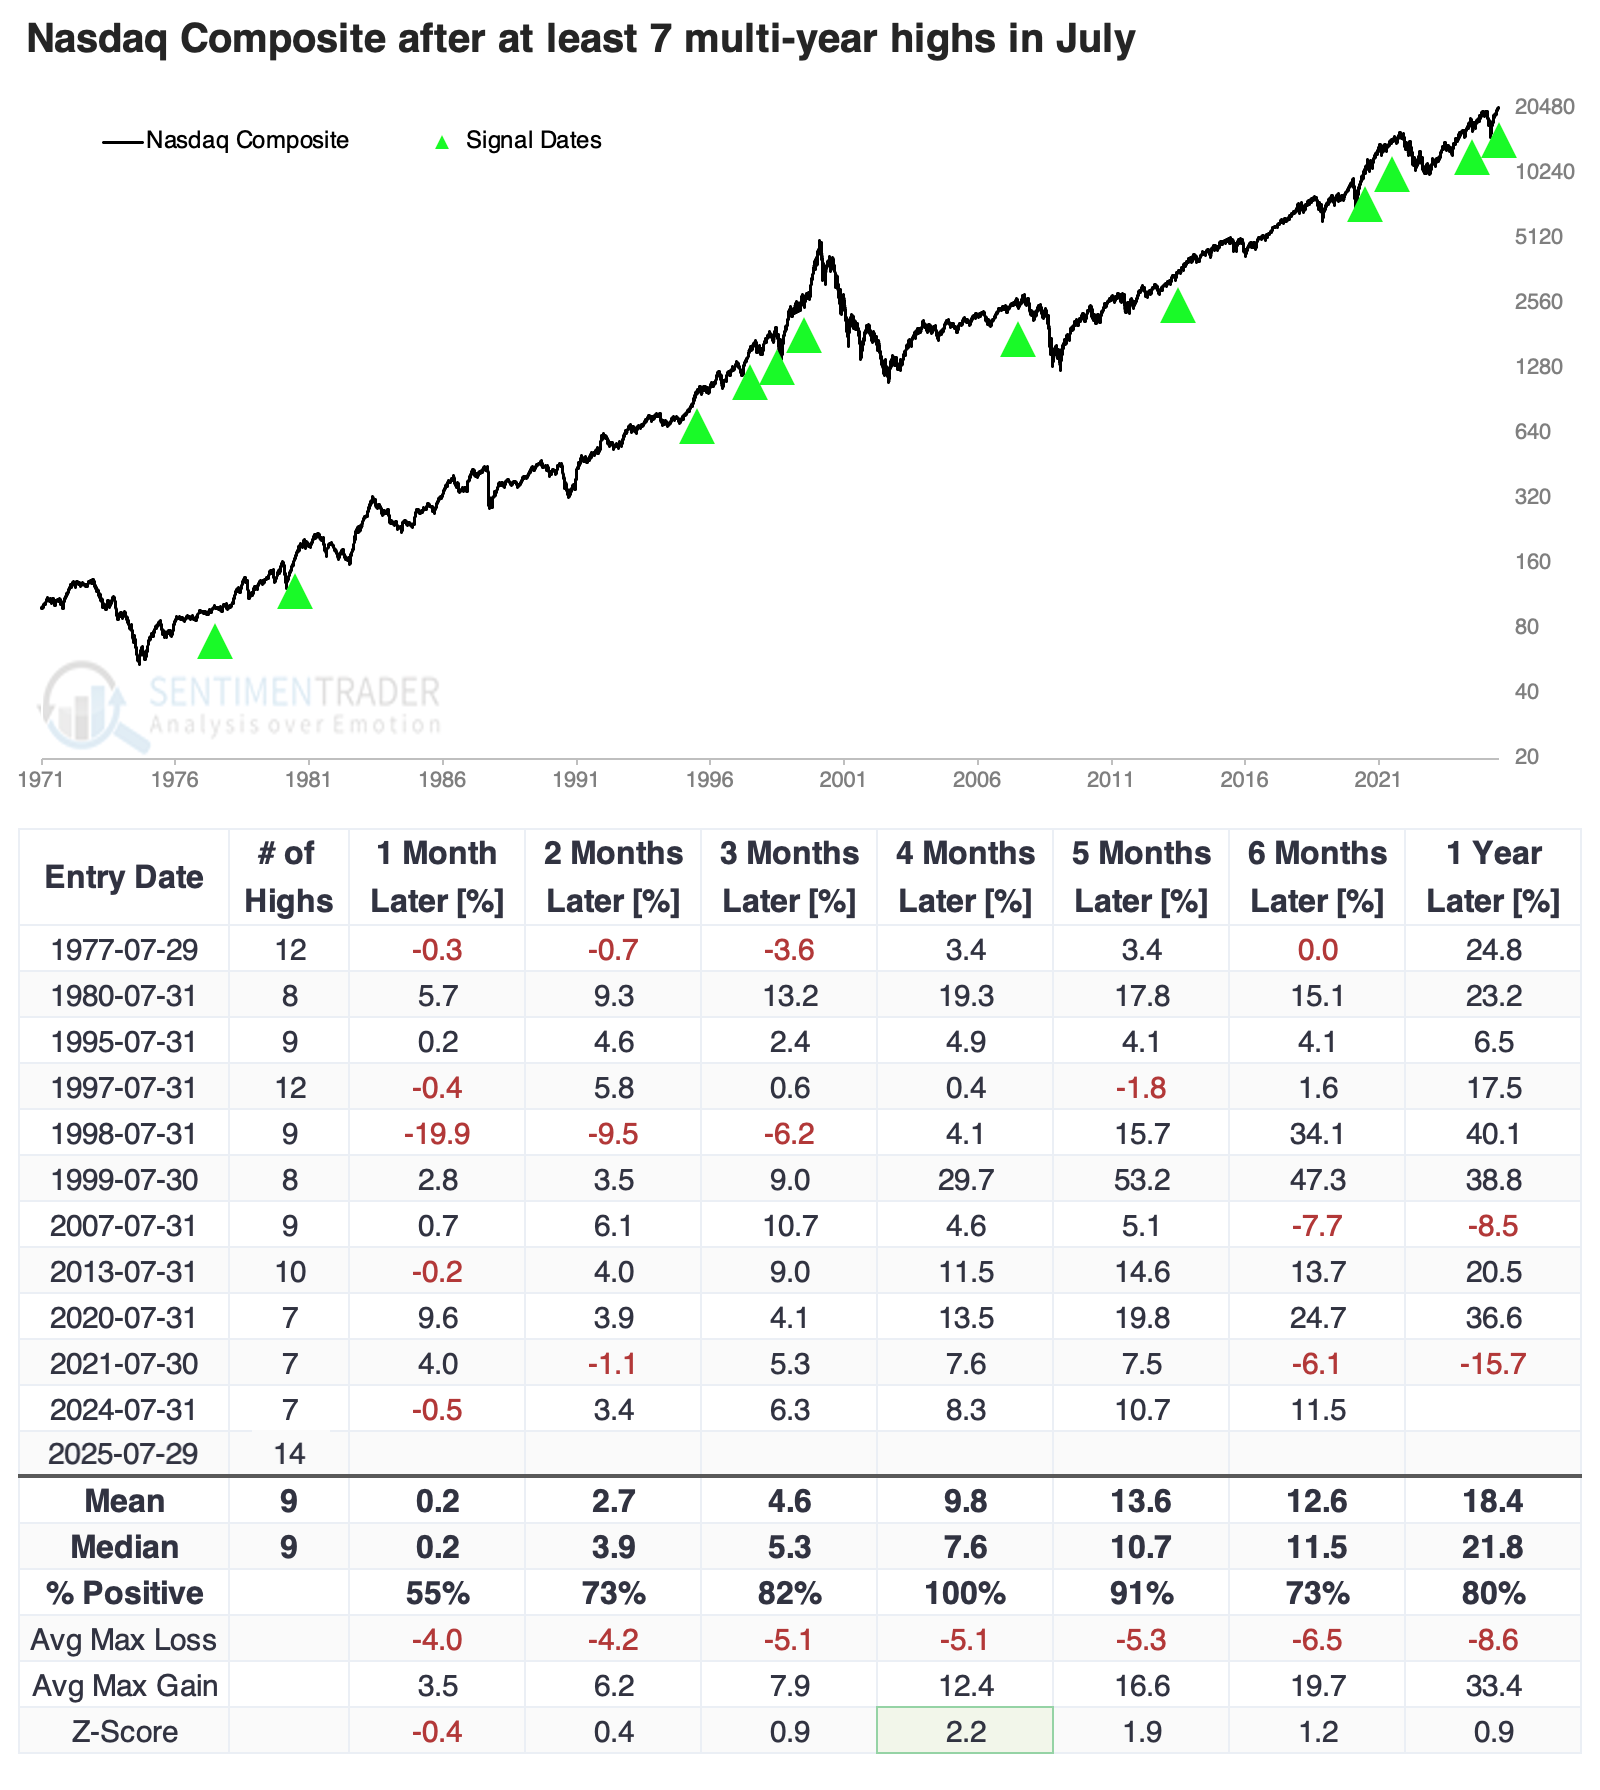
The table below shows Nasdaq returns after we relax the threshold to seven or more multi-year highs in July. August was a crapshoot, with a mix of returns and no clear pattern. But it was hard to keep this index down, and by four months later, the Composite showed a gain every time, with an impressive average return and decent risk/reward ratio.
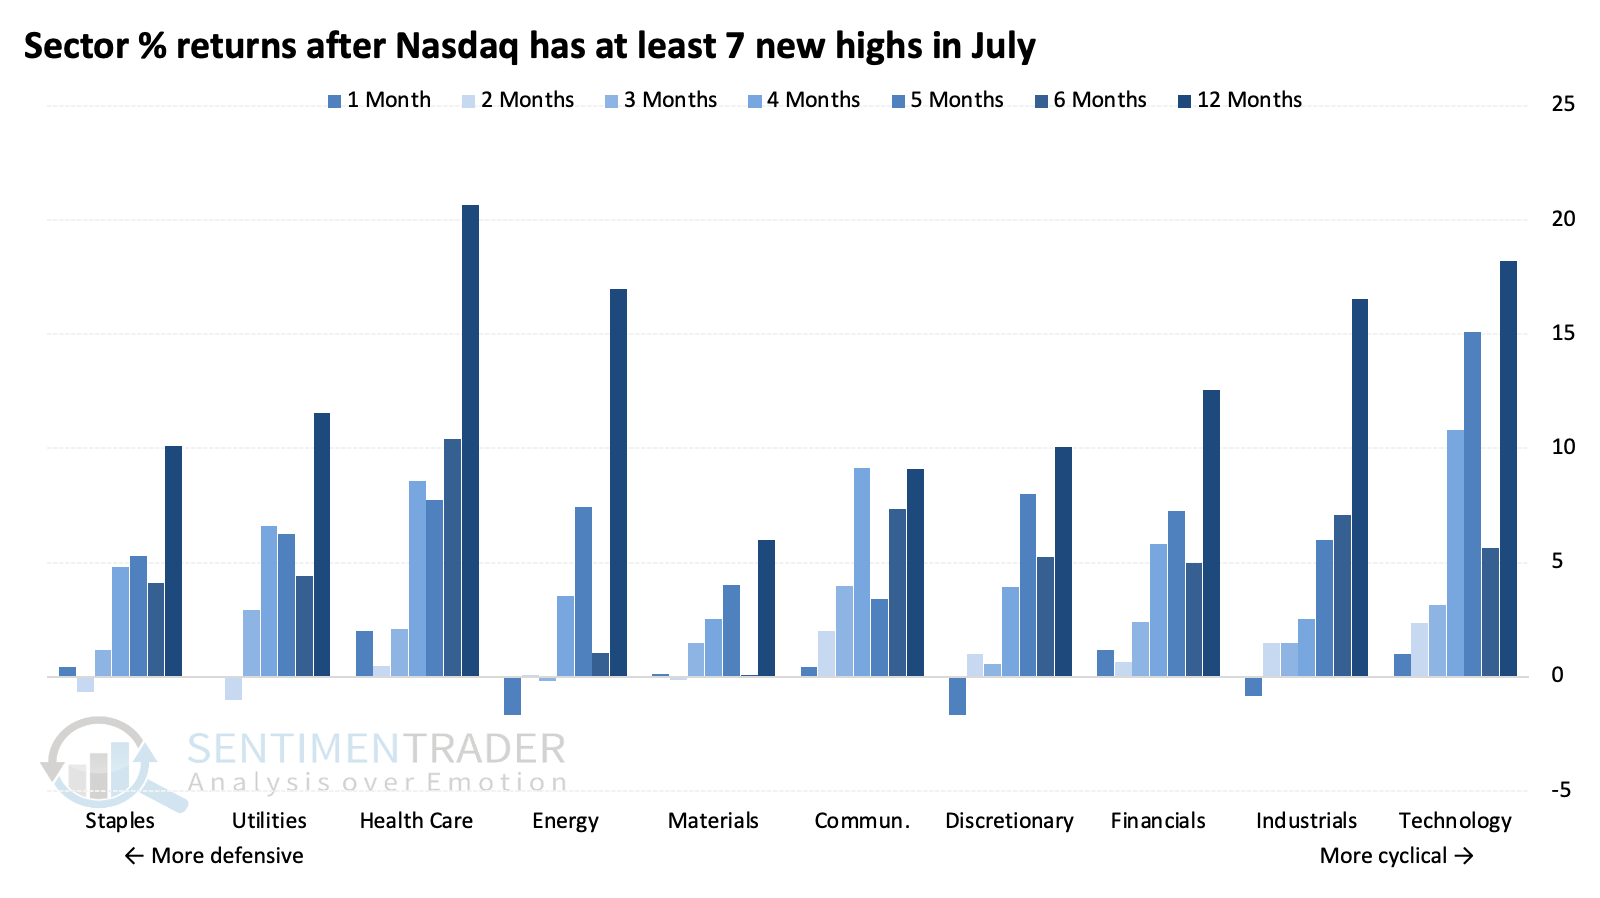
These good Julys in the Nasdaq preceded some interesting sector returns. Technology enjoyed the most robust returns from four months and beyond, which makes sense given the table above. But health care returns were also impressive. And other defensive sectors like consumer staples and utilities didn't trail cyclical sectors like industrials, financials, and consumer discretionary by much. These years with July super months in the Nasdaq seemed to benefit tech and that's pretty much it.
What the research tells us...
Momentum has been momentous for some of the big, popular indices like the S&P 500 and Nasdaq Composite. That is usually a good sign, but a twist is when we're seeing it. It has been relatively unusual to see such significant clusters of multi-year highs in these indices at this time of year.
As we head into some of the lowest-volume trading of the year in August, it has usually proved to be a good time for traders to take profits and relax on the beach. None of this suggests a sell signal, especially beyond the next month or so. It does indicate that the upside may be limited as buyers relax after an impressive month.