Products
SentimenTrader Trading Tools
‍
Backtest Engine
My Trading Toolkit
Correlation Analysis
Seasonality
Indicators & Data API
‍
Proprietary Indicators & Charts
Market Data API
Strategies & Scanner
‍
50+ Trading Strategies
Smart Stock Scanner
Research Reports
‍
Research Solutions
Reports Library
Free Resources
Simple Backtest Calculator
Simple Seasonality Calculator
The Kelly Criterion Calculator
Sentiment Geo Map
Public Research Reports
Pricing
Company
About
In the News
Testimonials
Client Success Stories
Contact
Log inLoginSign up
< BACK TO ALL REPORTS

The April Barometer (Part 1)

Jay Kaeppel
2021-05-04
Stock market performance during April - and for the first four months of the year as a whole - can at times offer useful clues regarding the performance of the stock market during the remainder of the year.

Well, if the fact that the stock market seems to be levitating and refuses to go down is driving you crazy, you are probably NOT going to like what follows. As it turns out, the stock market's performance during April - and for the first months of the year as a whole - can at times offer useful clues regarding the performance of the stock market during the remainder of the year. 

This is Part I.

THE TEST AND THE BENCHMARK

  • Our test will identify those times when the S&P 500 Index gained 5% or more (using price only data) during April as a whole 
  • We will then look at the performance for the S&P 500 Index during the remainder of the year (May through December)
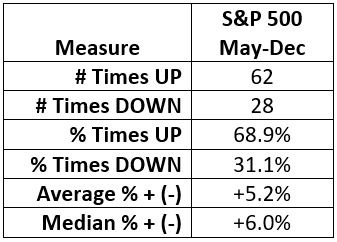
  • As a benchmark, let's first let's look at how the S&P 500 typically performs from May through December

THE MONTH OF APRIL UP +5% OR MORE

The table below displays only those years since 1931 when the S&P 500 showed a price gain of +5% or more during April.
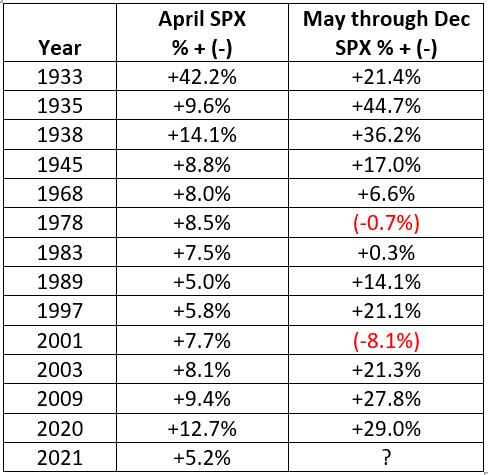
In sum:

  • Up 11 times (85% of the time)
  • Down 2 times (14% of the time)
  • Average May-Dec gain = +21.8%
  • Average May-Dec loss = (-4.4%)
  • Median May-Dec gain = +21.3%
  • Median May-Dec loss = (-4.4%)

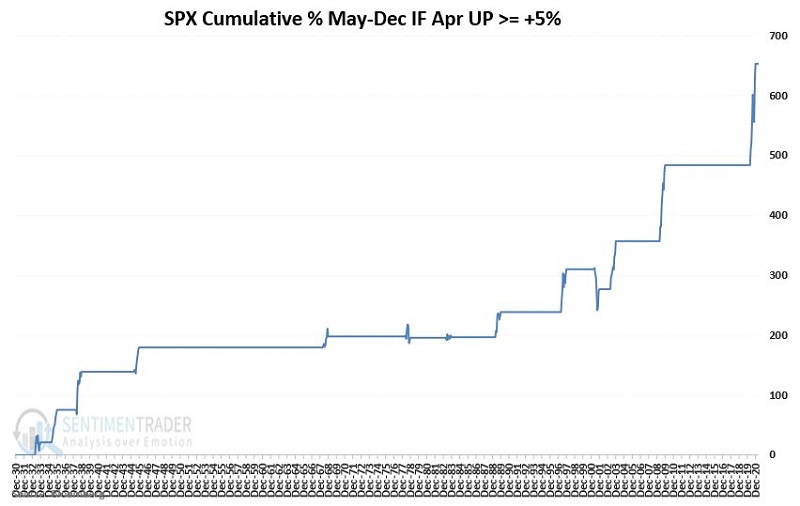
The chart below displays the cumulative price gain for the S&P 500 Index held ONLY during May through December of the years listed in the table above to provide a sense of consistency.

SUMMARY

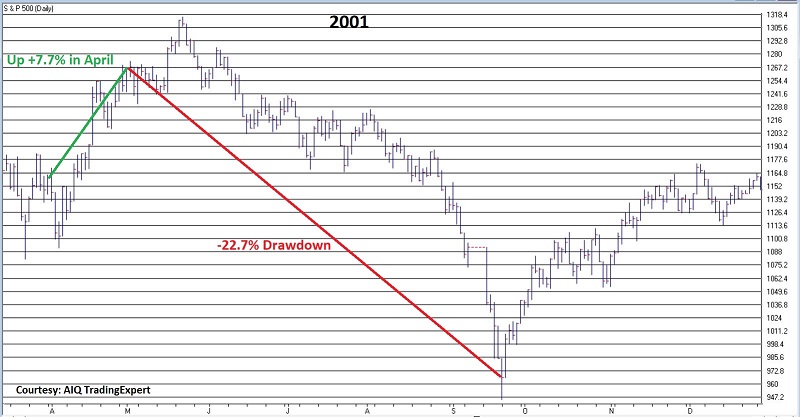
So, does the S&P 500 Index rising +5.2% during April 2021 ensure that the rest of 2021 is "smooth sailing" for stocks? Not at all. The chart below displays the performance of the S&P 500 during 2001. Note that after a +7.7% gain in April, the S&P 500:

  • Suffered a -22.7% drawdown into the September low
  • Closed the May-Dec period down -8.1%

So, remember this:

  • A strong performance during April lends bullish weight to the overall weight of the evidence
  • But there are never (even in this current runaway bull market) any "sure things" in the market

Sorry, you don't have access to this report

Upgrade your subscription plan to get access
Go to Dasboard
PRODUCTS
SentimenTrader
Trading Tools
Indicators & Data API
‍
Strategies & Scanner
‍
Research Reports
FREE
RESOUrCES
Simple Backtest
Calculator
Simple Seasonality
Calculator
The Kelly Criterion
Calculator
Sentiment Geo Map
‍
Public Research Reports
‍
Pricing
Bundle pricing
‍
Announcements
‍
FAQ
COMPANY
‍
About
‍
In the News
‍
Testimonials
‍
Client Success Stories
CONTACT
‍
General Inquiries
‍
Media Inquiries
‍
Financial Professionals Inquiries
‍
© 2025 Sundial Capital Research Inc. All rights reserved.
Setsail Marketing
TermsPrivacyAffiliate Program
Risk Disclosure: Futures and forex trading contains substantial risk and is not for every investor. An investor could potentially lose all or more than the initial investment. Risk capital is money that can be lost without jeopardizing ones’ financial security or life style. Only risk capital should be used for trading and only those with sufficient risk capital should consider trading. Past performance is not necessarily indicative of future results.

Hypothetical Performance Disclosure: Hypothetical performance results have many inherent limitations, some of which are described below. No representation is being made that any account will or is likely to achieve profits or losses similar to those shown; in fact, there are frequently sharp differences between hypothetical performance results and the actual results subsequently achieved by any particular trading program. One of the limitations of hypothetical performance results is that they are generally prepared with the benefit of hindsight. In addition, hypothetical trading does not involve financial risk, and no hypothetical trading record can completely account for the impact of financial risk of actual trading. for example, the ability to withstand losses or to adhere to a particular trading program in spite of trading losses are material points which can also adversely affect actual trading results. There are numerous other factors related to the markets in general or to the implementation of any specific trading program which cannot be fully accounted for in the preparation of hypothetical performance results and all which can adversely affect trading results.

Testimonial Disclosure: Testimonials appearing on this website may not be representative of other clients or customers and is not a guarantee of future performance or success.