
The approaching holiday marks a favorable period for large and small caps

Key points
- The stock market tends to perform well around market holidays
- The next several weeks also mark a generally favorable time of year for stocks
- If history is a guide, small caps may do some "catching up" in the weeks ahead
Small caps enter a favorable seasonal window
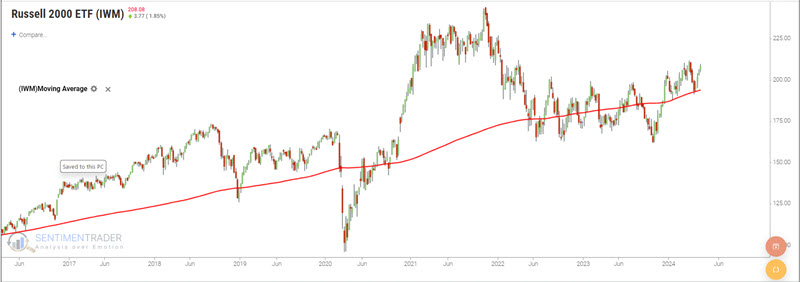
The small-cap space has lagged large-caps for a number of years. This author has no prediction as to when that trend will change. The chart below looks at the Russell 2000 Index. Small caps have yet to challenge their previous all-time highs. However, they have established an uptrend above the 200-day moving average.
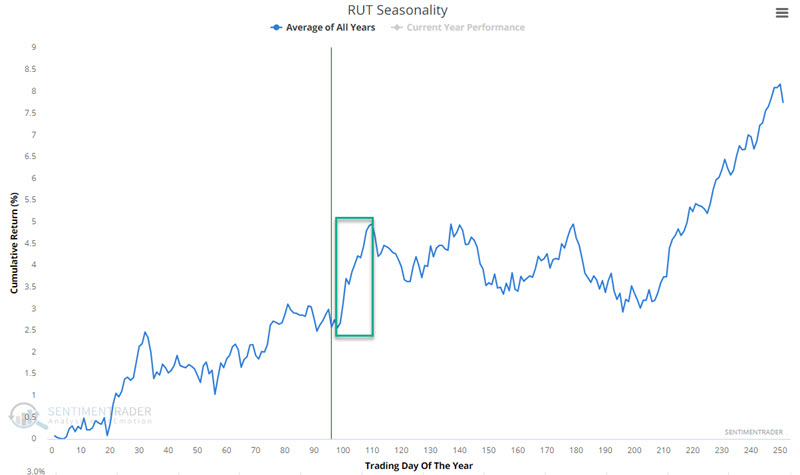
The chart below displays the annual seasonal trend for small caps. Note the brief favorable window (typically includes the dates around the Memorial Day holiday) extending from the close on Trading Day of Year (TDY) #98 through TDY #110.
For 2024, this period extends from the close on 2024-05-20 through the close on 2024-06-07.
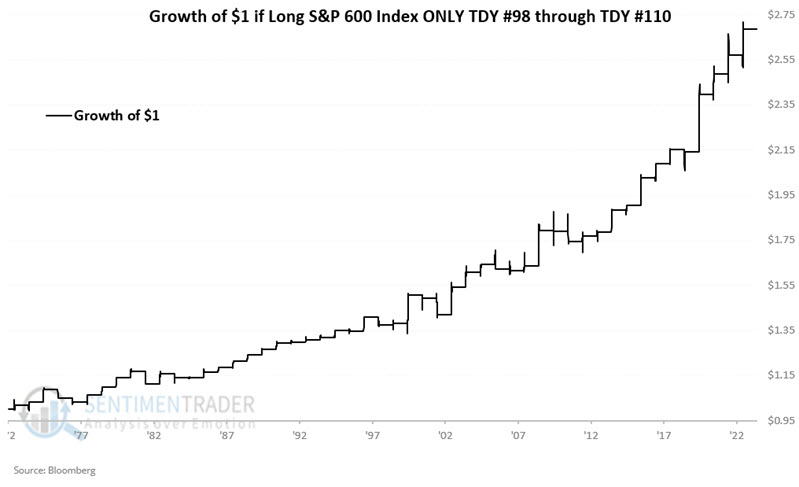
To examine the history, we will use the action of the FAMA French Index from 1973 to 1991 and then the S&P 600 small-cap index after that. The chart below displays the hypothetical growth of $1 invested in the S&P 600 Index only from the close on Trading Day of the Year (TDY) #98 through TDY #110.
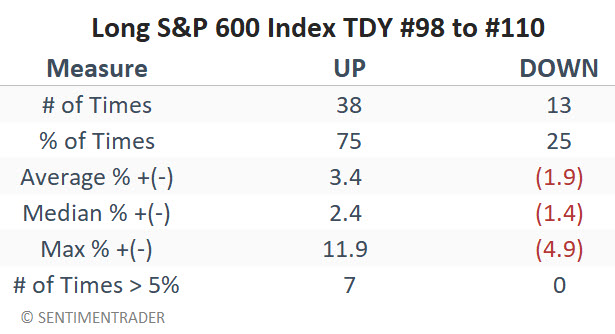
The table below summarizes the small-cap index performance during this favorable seasonal window.
For large caps, almost the same window but slightly lesser results
Following a pullback in April, large-cap stocks have rallied sharply to new all-time highs, as seen in the chart below.
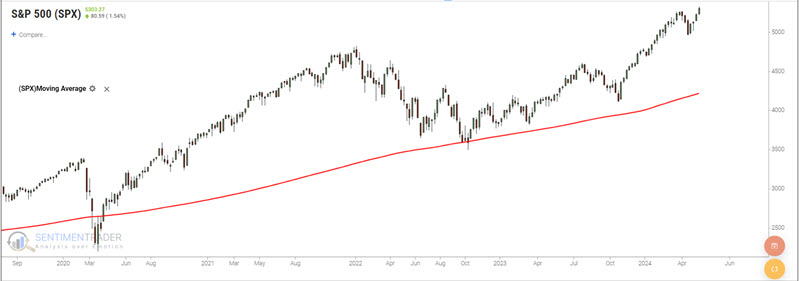
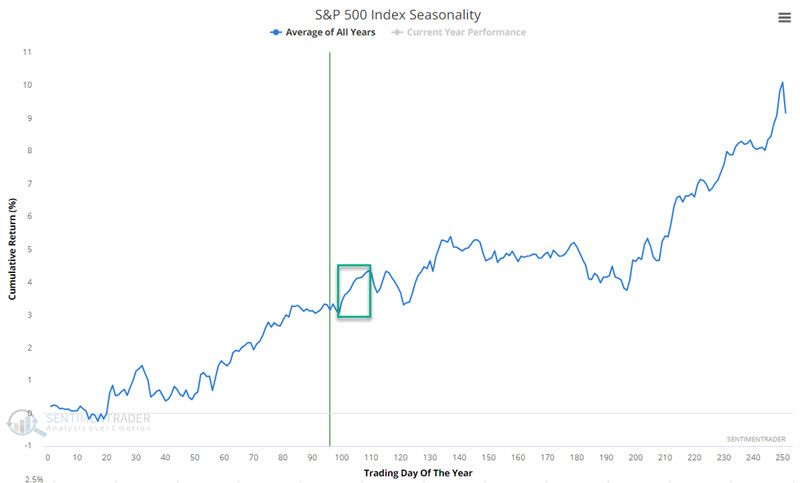
The chart below displays the annual seasonal trend for the S&P 500 large-cap index. Note a similar but slightly different favorable window around Memorial Day. For large caps, that period extends from the close on Trading Day of Year (TDY) #99 through TDY #109.
For 2024, this period extends from the close on 2024-05-21 through the close on 2024-06-06.
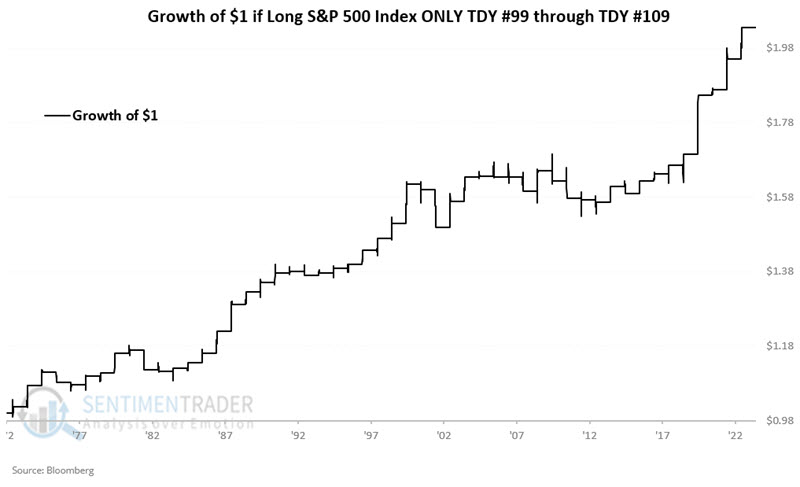
The chart below displays the hypothetical growth of $1 invested in the S&P 500 Index only from the close on Trading Day of the Year (TDY) #99 through TDY #109.
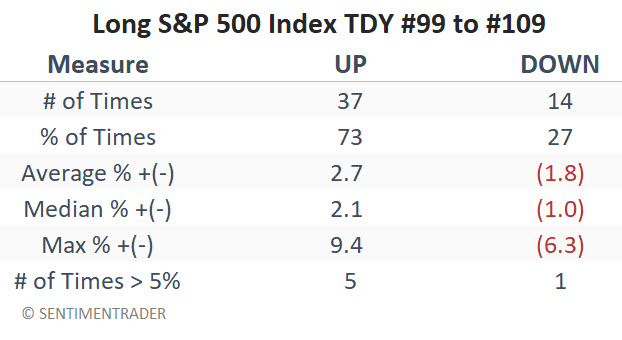
The table below summarizes the S&P 500 Index performance during this favorable seasonal window.
What the research tells us…
It is generally a risky move to rely solely on seasonality as a basis to initiate a trade. The best time to employ seasonality is when price action agrees with the purported seasonal trend. In this case, the stock market has shown a historical tendency to rally around this time of year, AND stock index prices are in a clearly established uptrend. While this configuration does not guarantee higher prices in the period directly ahead, it does suggest better-than-average odds for those willing to enter a speculative short-term trade. The fact that a holiday period is included and that the stock market tends to perform well around market holidays lends further weight to the favorable case for stocks.