
The 4th Federal Reserve target rate increase

Key points:
- The Federal Open Market Committee increased the federal fund's target rate for the 4th time
- A 4th target rate increase preceded negative returns in the 6 & 12-month time frames for stocks
- A commodity index looks constructive, the yield curve contracts, and the Macro Index Model stumbles
FOMC interest rate cycles
Let's assess the outlook for stocks, commodities, the yield curve, and the Macro Index Model after the FOMC increases the target rate for the 4th time. This study uses the fed funds target rate since 1989 and the discount rate in prior instances. My previous note on the 3rd interest rate increase contained two more signals. i.e., the FOMC hiked for the 3rd time but not a fourth.
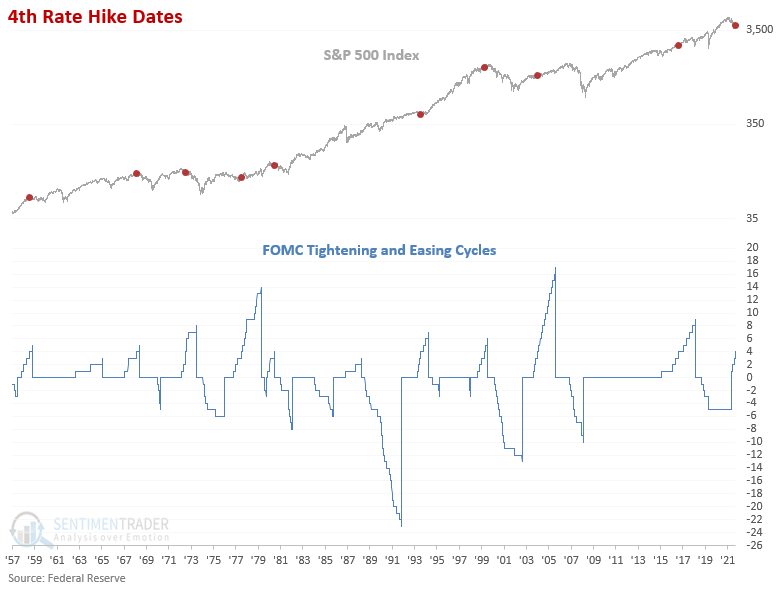
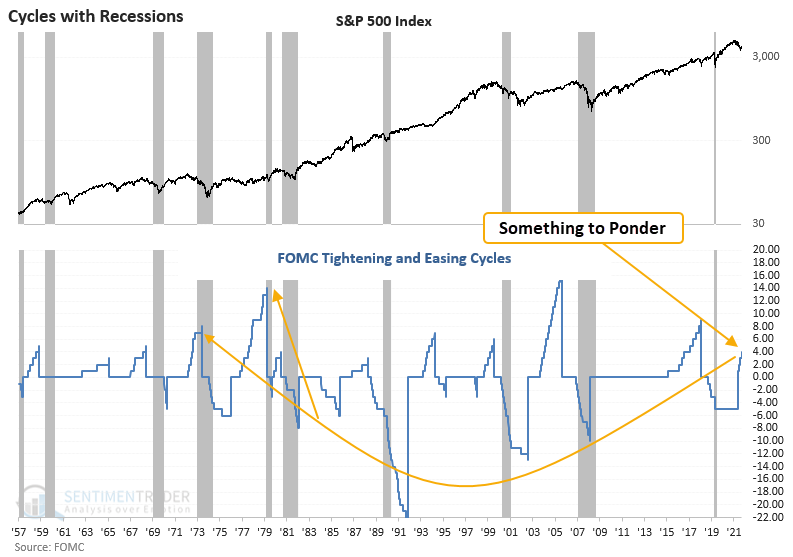
The FOMC typically pauses tightening cycles in advance of recessions. Suppose you're looking for a potential analog for a period when they remained unfriendly leading up to a recession. In that case, the inflationary 1970s might do the trick.
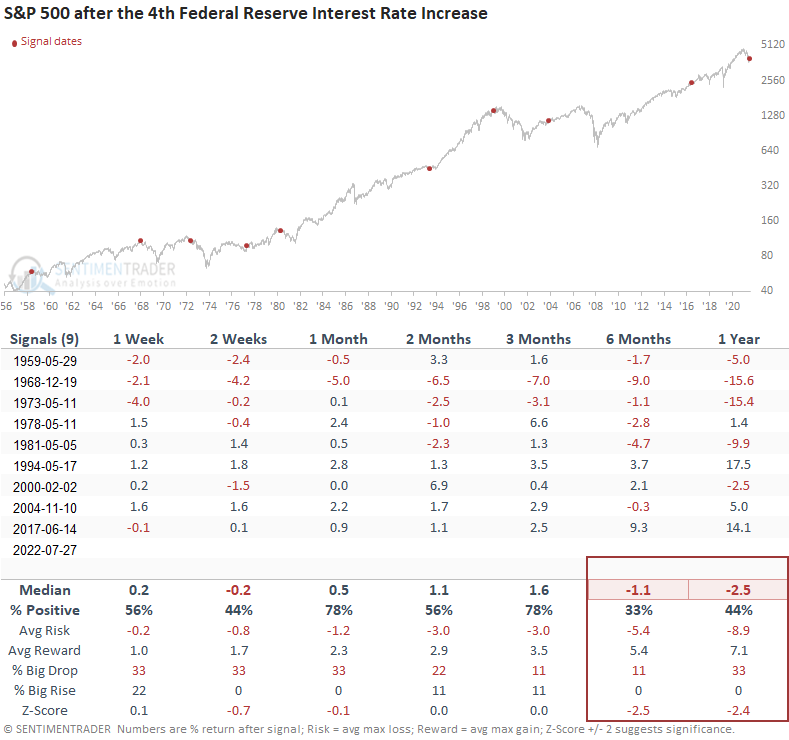
Stocks after the 4th increase in the target rate
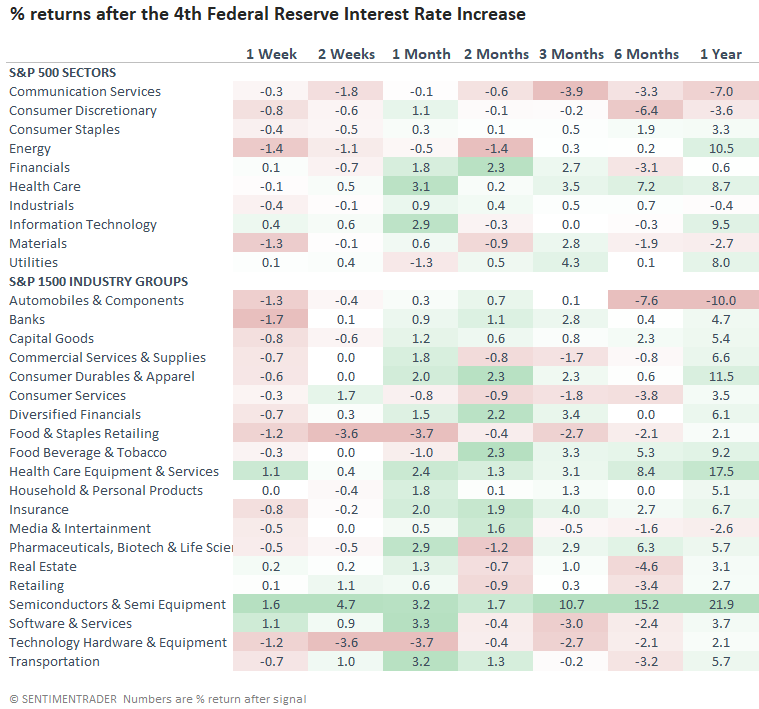
The 4th increase in the target rate preceded somewhat flat returns for the next few months and a negative outlook in the 6 & 12-month windows.
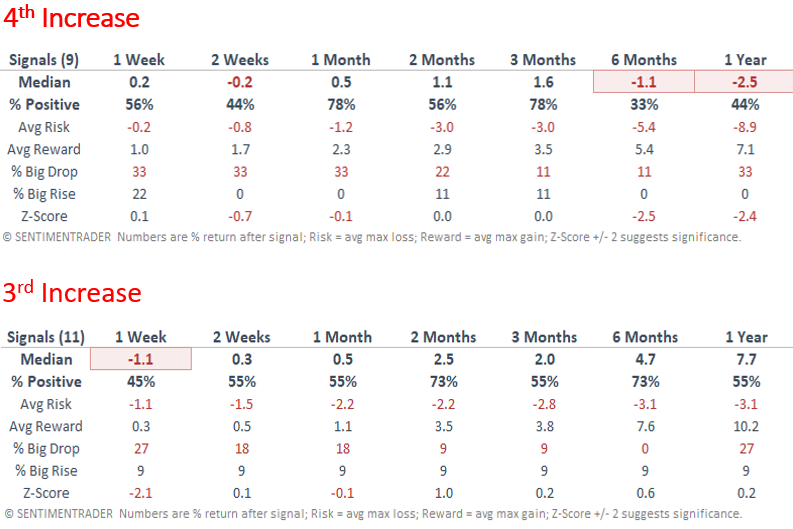
If we compare the 4th rate increase to the 3rd, the impact on stock returns is noticeable, especially in the 6th and 12-month windows.
Interest rate-sensitive groups tend to struggle, especially the automobiles and components industry. Not surprisingly, a defensive group like health care holds up well.
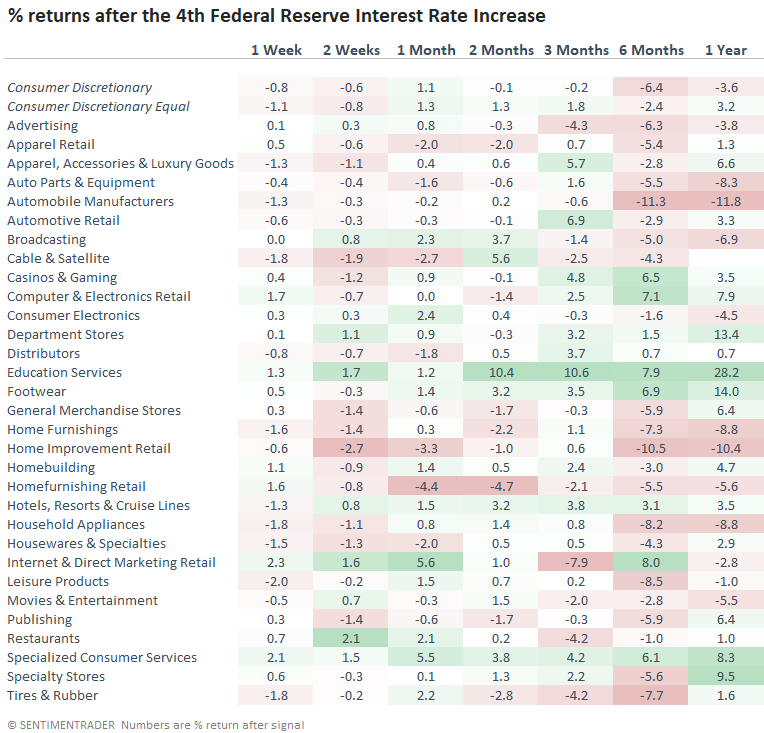
The consumer discretionary sub-industry table shows a similar theme. Individual groups within autos and housing can't escape the impact of higher rates.
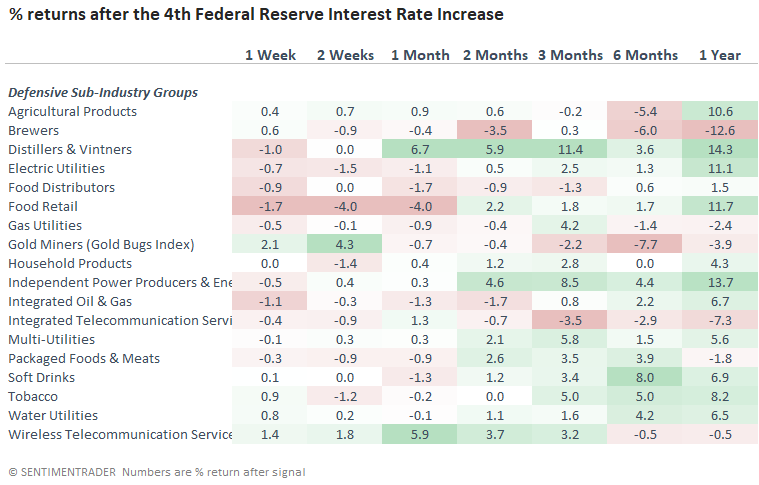
Defensive sub-industry groups underperformed in the first 4 weeks. However, except for a few groups, the 6 & 12-month time frames look much better than the broad market.
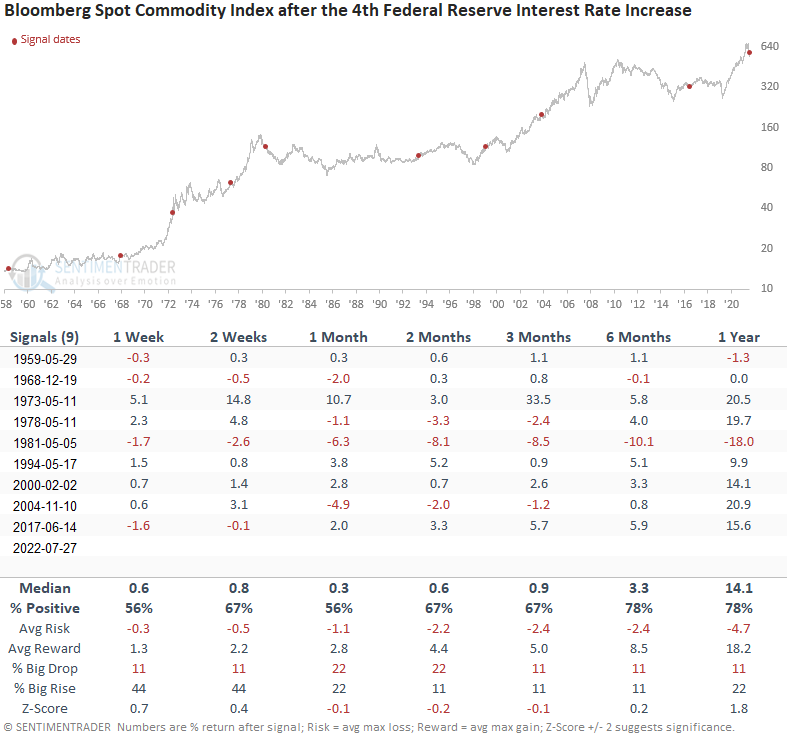
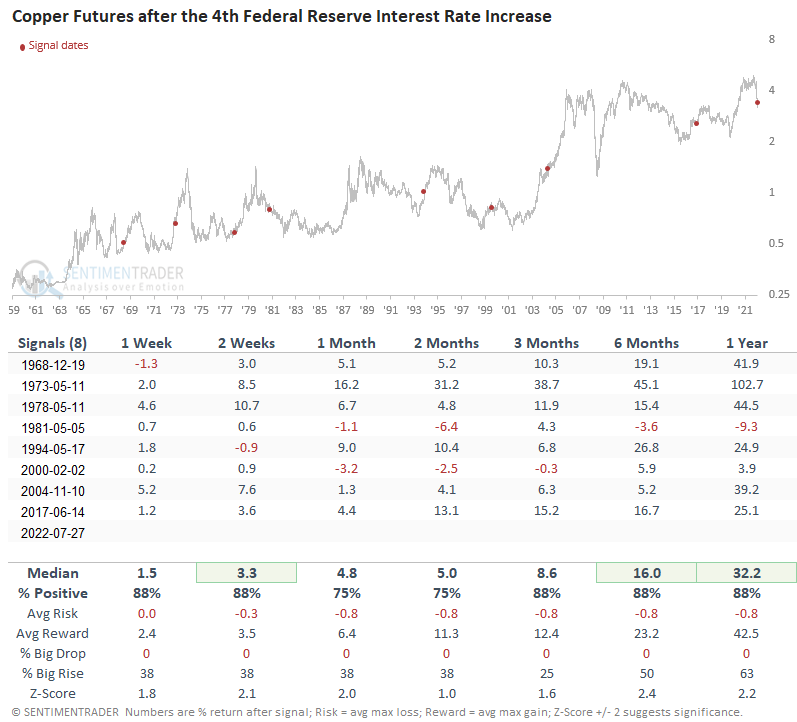
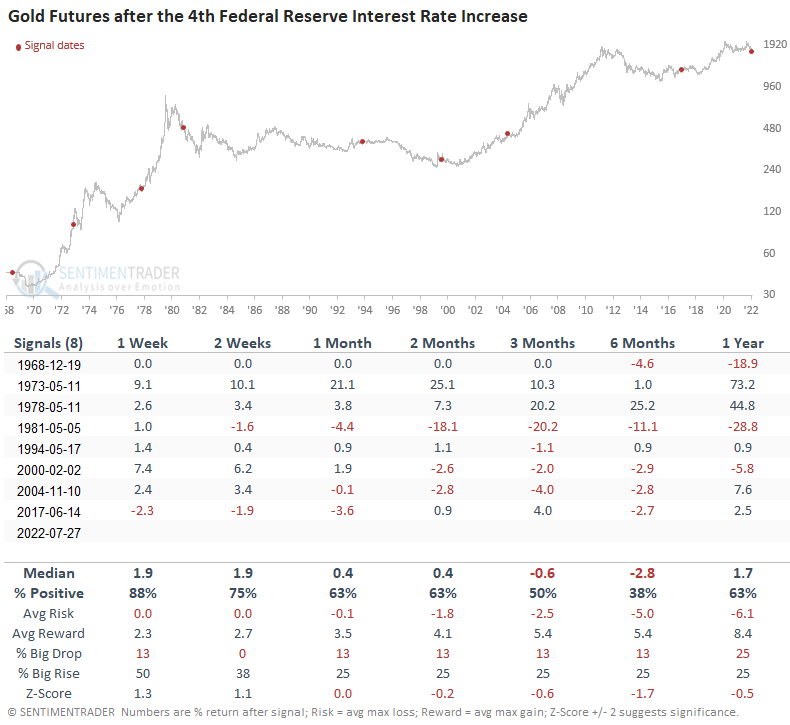
Commodities after the 4th increase in the target rate
Commodities performed well across all time frames, especially the 1-year window.
As with the Bloomberg commodity index, copper looks constructive except for the 1981 instance. The copper outlook table contains one less signal due to data limitations.
The 1-week time frame provides a compelling case for a bounce in gold. However, the 3 & 6-month windows should remind us that the overall environment is unhealthy. The gold outlook table contains one less signal due to data limitations.
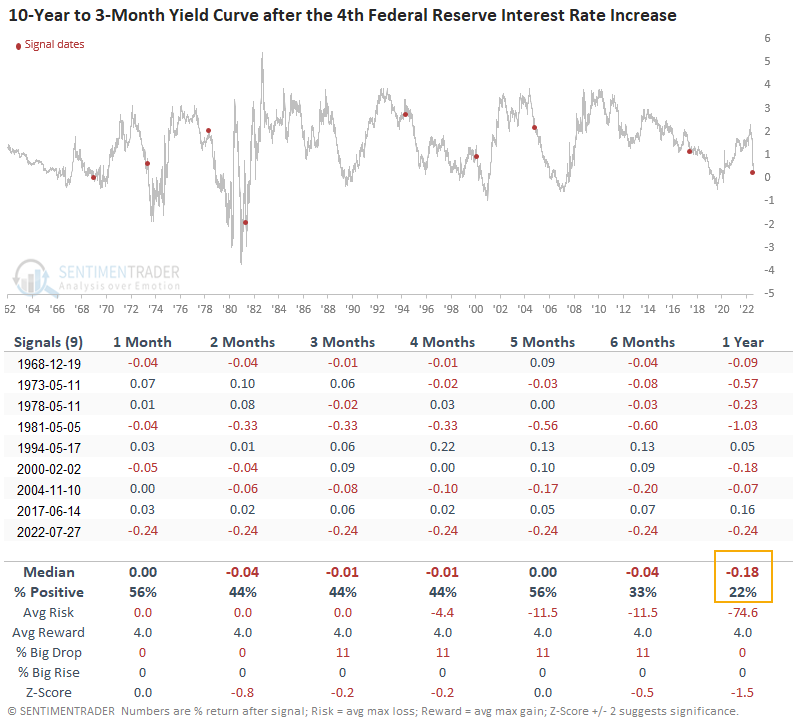
Yield curve after the 4th increase in the target rate
In my previous note, where I shared what happens after the 3rd rate hike, I made the following statement. "I suspect a bet on a yield curve flattener makes sense at some point." That was an understatement. The odds of an inverted 10-year to 3-month yield curve look compelling.
Macro Index Model after the 4th increase in the target rate
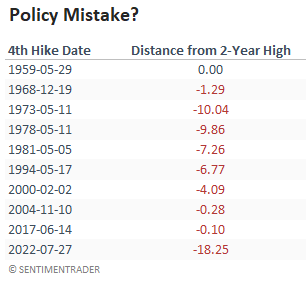
As with the 3rd rate hike analysis, market participants should be concerned about a policy mistake as the Macro Index Model remains at the lowest level in history at the time of a 4th target rate increase.
Due to data limitations, the outlook table contains 3 fewer signals.
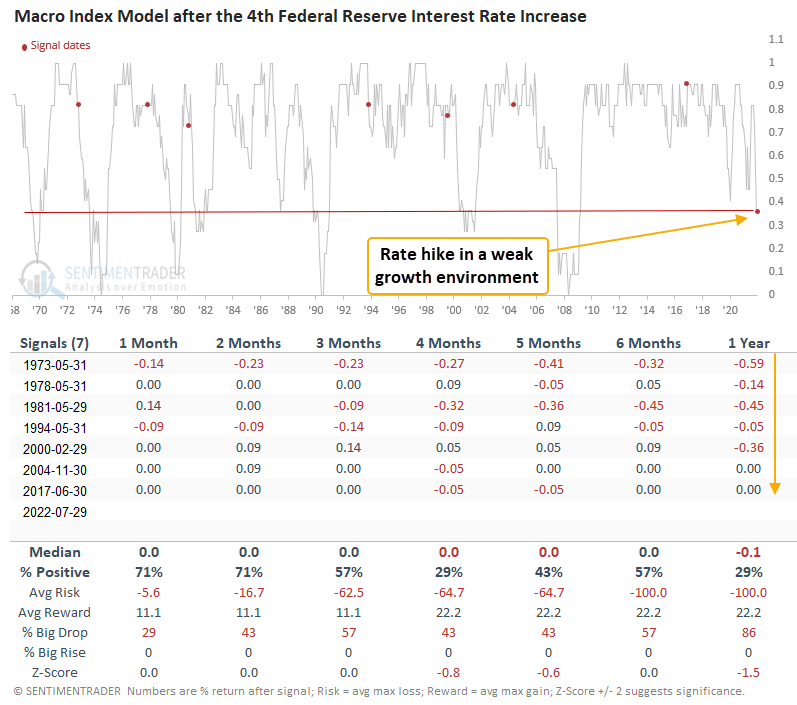
The S&P 500 has never been down this much from a high when the FOMC increases interest rates. Unfortunately, we will only know what the market has discounted in hindsight.
What the research tells us...
When the Federal Reserve increases the target rate for the 4th time, the unfriendly interest rate environment tends to weigh on stocks, especially in the 6 & 12-month time frame. A broad basket of commodities looks constructive, with a compelling record a year later. Copper, an industrial metal, performs well, and gold tends to underwhelm on a longer-term basis. When I apply the signals to the yield curve, one should not be surprised by an inversion in the 10-year to 3-month curve, especially given the recent drop and the negative 10-2 spread. Based on the Macro Index Model, the economy could deteriorate further.