Products
SentimenTrader Trading Tools
‍
Backtest Engine
My Trading Toolkit
Correlation Analysis
Seasonality
Indicators & Data API
‍
Proprietary Indicators & Charts
Market Data API
Strategies & Scanner
‍
50+ Trading Strategies
Smart Stock Scanner
Research Reports
‍
Research Solutions
Reports Library
Free Resources
Simple Backtest Calculator
Simple Seasonality Calculator
The Kelly Criterion Calculator
Sentiment Geo Map
Public Research Reports
Pricing
Company
About
In the News
Testimonials
Client Success Stories
Contact
Log inLoginSign up
< BACK TO ALL REPORTS

Thanksgiving Selling; Heavy Pessimism; Monday Gaps

Jason Goepfert
2018-11-26
null

There certainly wasn't much of the typical pre-holiday buoyancy in markets last week. Bucking the traditionally positive, low-volatility holiday trading, markets got hit hard, particularly the stock market.

That left the S&P 500 at a 6-month low the day after Thanksgiving, which has never happened before, at least since 1950. It's never even been at a 3-month low the day after that holiday. It has sunk to a 1-month low only a few times, and for what it's worth, it rebounded strongly afterward each time.

As we start the new week, futures are indicating a hefty rebound from last week's losses. The concern is that this is not something we often see during bull markets.

This is true, but it doesn't mean that just because we're seeing high volatility that we're in a bear market. It just means that during bear markets, volatility tends to be high. Maybe that's a difference without a distinction.

Either way, the S&P futures were looking at an open more than 1% above Friday's closing prices. This would be one of the strongest-ever openings to start a week following what had been a 6-month low on Friday.

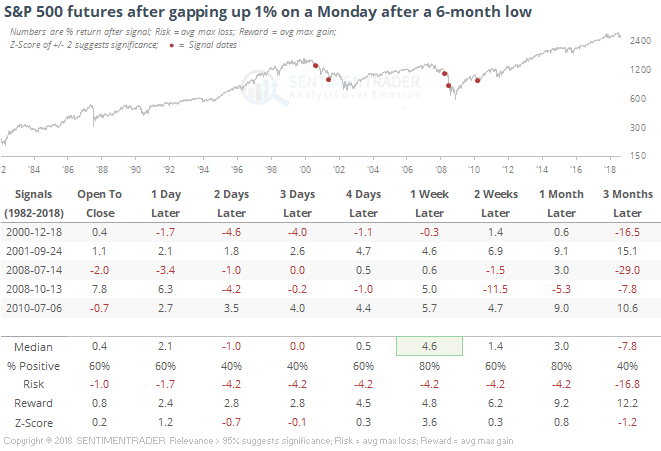
After similar Monday morning gaps, buyers tended to persist into the close, but the sample size is awfully small. And there was a big loser in there, too. Over the next 2-3 days, the enthusiasm petered out, but a week later, there was only one minor loss.

If we loosen the parameters to get a larger sample, that general bias is still prevalent.

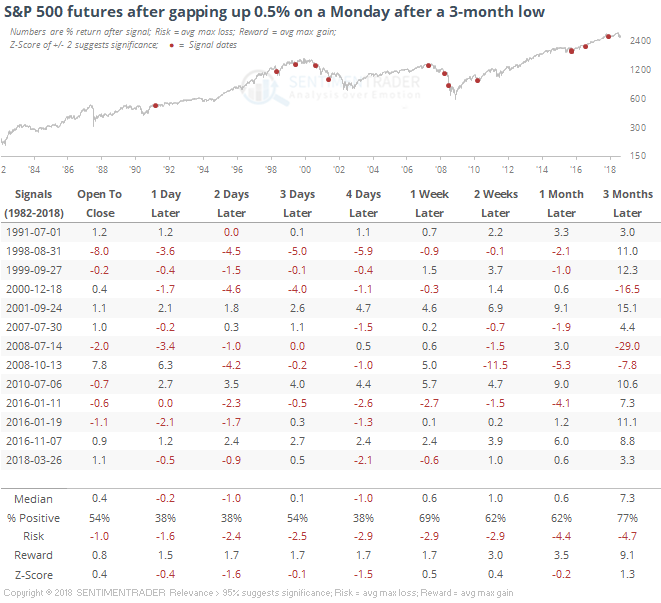
When the futures gap up 0.5% or more on a Monday following a 3-month low, we tended to see weakness from the open through the next 1-2 days, but gains about 2/3 of the time over the next week. Not really a strong edge.

The decline last week was enough to push some of our indicators into an extreme position again. The spread between Smart Money and Dumb Money Confidence moved to 54%, which has preceded consistently strong returns over the next 1-2 months, even including bear market environments.

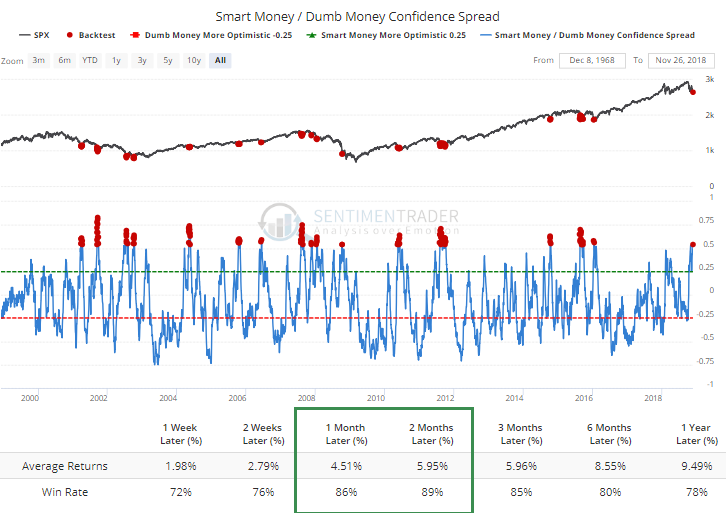
Seasonally we're in a very strong period, especially when there has been some weakness, as we saw above. Sentiment is also showing signs of extreme pessimism, which is another tailwind. The big gap on a Monday is often the kind of behavior we see during bear markets, but that's not necessarily a negative, especially over the next week or so.

Sorry, you don't have access to this report

Upgrade your subscription plan to get access
Go to Dasboard
PRODUCTS
SentimenTrader
Trading Tools
Indicators & Data API
‍
Strategies & Scanner
‍
Research Reports
FREE
RESOUrCES
Simple Backtest
Calculator
Simple Seasonality
Calculator
The Kelly Criterion
Calculator
Sentiment Geo Map
‍
Public Research Reports
‍
Pricing
Bundle pricing
‍
Announcements
‍
FAQ
COMPANY
‍
About
‍
In the News
‍
Testimonials
‍
Client Success Stories
CONTACT
‍
General Inquiries
‍
Media Inquiries
‍
Financial Professionals Inquiries
‍
© 2025 Sundial Capital Research Inc. All rights reserved.
Setsail Marketing
TermsPrivacyAffiliate Program
Risk Disclosure: Futures and forex trading contains substantial risk and is not for every investor. An investor could potentially lose all or more than the initial investment. Risk capital is money that can be lost without jeopardizing ones’ financial security or life style. Only risk capital should be used for trading and only those with sufficient risk capital should consider trading. Past performance is not necessarily indicative of future results.

Hypothetical Performance Disclosure: Hypothetical performance results have many inherent limitations, some of which are described below. No representation is being made that any account will or is likely to achieve profits or losses similar to those shown; in fact, there are frequently sharp differences between hypothetical performance results and the actual results subsequently achieved by any particular trading program. One of the limitations of hypothetical performance results is that they are generally prepared with the benefit of hindsight. In addition, hypothetical trading does not involve financial risk, and no hypothetical trading record can completely account for the impact of financial risk of actual trading. for example, the ability to withstand losses or to adhere to a particular trading program in spite of trading losses are material points which can also adversely affect actual trading results. There are numerous other factors related to the markets in general or to the implementation of any specific trading program which cannot be fully accounted for in the preparation of hypothetical performance results and all which can adversely affect trading results.

Testimonial Disclosure: Testimonials appearing on this website may not be representative of other clients or customers and is not a guarantee of future performance or success.