Products
SentimenTrader Trading Tools
‍
Backtest Engine
My Trading Toolkit
Correlation Analysis
Seasonality
Market Prediction
Indicators & Data API
‍
Proprietary Indicators & Charts
Market Data API
Strategies & Scanner
‍
50+ Trading Strategies
Smart Stock Scanner
Smart Option Scanner
Research Reports
‍
Research Solutions
Reports Library
Free Resources
Simple Backtest Calculator
Simple Seasonality Calculator
The Kelly Criterion Calculator
Sentiment Geo Map
Public Research Reports
Education
Sentiment Indicators
Technical Indicators
Pricing
Company
About
In the News
Testimonials
Client Success Stories
Contact
Log inLoginSign up
< BACK TO ALL REPORTS

Tesla Serves As A Speculative Spigot

Jason Goepfert
2020-02-11
Returns after an S&P 500 or Nasdaq 100 stock jumps 50% in a week were poor. The Growth / Value ratio has become overbought.

Speculative spigot

While it’s arguable to suggest that investors were showing speculative excesses in January, with many indications that they were, recently one of the few signs is trading activity in Tesla. Looking at other large jumps in compressed time frames among major equity index members, this is a worrying sign.

Stock jumps 50% in a week

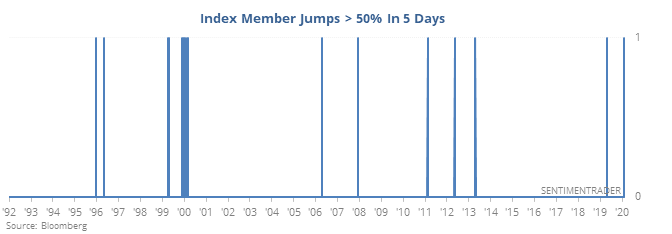
Returns in the S&P 500 and Nasdaq 100 after any day in which a (current) member of the S&P 500 or Nasdaq 100 jumped more than 50% over only a week’s time were poor.

There was a cluster in 1999-00 (of course), but even outside of that, and even in recent years, such enthusiasm for an established stock has led to mostly poor shorter-term returns for the indexes themselves.


Growth vs. Value

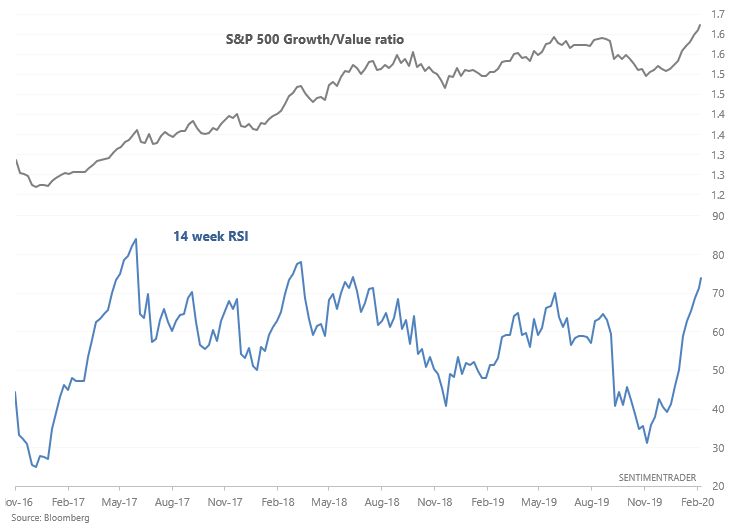
Growth has been all the rage throughout this bull market, and continues to be so. Tech continues its nonstop rally, and stocks like Tesla are popping.

Turning Growth vs. Value into a ratio, it's clear that growth has surged over the past few months, pushing the ratio's 14 week RSI into overbought territory (i.e. >70).

Growth versus value relative strength index

Does this automatically mean that growth will underperform relative to value in the near future? Not necessarily. Here's what happened to the ratio between them after it reached an extreme:

Growth versus value overbought

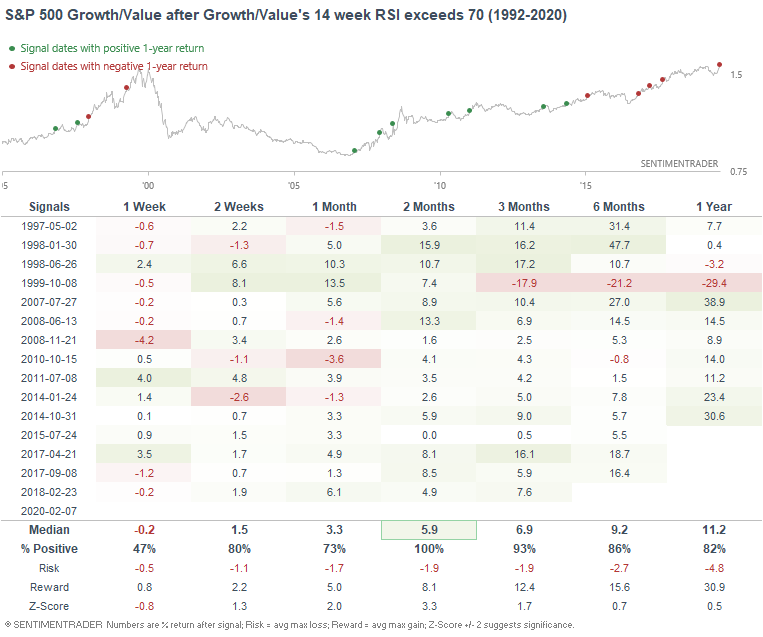
In some cases, extreme momentum isn't a very useful contrarian sign. Instead, it's a sign that "strength begets more strength". In this case, strong momentum in Growth vs. Value usually led to Growth outperforming over the next 2 months.

This is an abridged version of our recent reports and notes. For immediate access with no obligation, sign up for a 30-day free trial now.

We also looked at:

  • Stocks are hitting new highs, but with a negative McClellan Oscillator
  • The S&P and U.S. dollar are reaching new highs at the same time - what it means
  • The S&P 500 / Commodities ratio is overbought, too
  • Yet more Hindenburg Omens are triggering
  • What happens after the Shanghai Composite falls to a 200-day low then rebounds
PRODUCTS
SentimenTrader
Trading Tools
Indicators & Data API
‍
Strategies & Scanner
‍
Research Reports
FREE
RESOUrCES
Simple Backtest
Calculator
Simple Seasonality
Calculator
The Kelly Criterion
Calculator
Sentiment Geo Map
‍
Public Research Reports
‍
Education
Sentiment Indicators
‍
Technical Indicators
‍
Pricing
Bundle pricing
‍
FAQ
‍
Announcements
‍
COMPANY
‍
About
‍
In the News
‍
Testimonials
‍
Client Success Stories
CONTACT
‍
General Inquiries
‍
Media Inquiries
‍
Financial Professionals Inquiries
‍
© 2026 Sundial Capital Research Inc. All rights reserved.
Setsail Marketing
TermsPrivacyAffiliate Program
Risk Disclosure: The information and tools provided are for research and analytical purposes only and are not intended as investment advice. Market analysis involves uncertainty, and outcomes may differ from expectations. Users should conduct their own due diligence and consider their individual circumstances before making any financial decisions. Past performance is not necessarily indicative of future results.

Hypothetical Performance Disclosure: Hypothetical performance results have many inherent limitations, some of which are described below. No representation is being made that any account will or is likely to achieve profits or losses similar to those shown; in fact, there are frequently sharp differences between hypothetical performance results and the actual results subsequently achieved by any particular trading program. One of the limitations of hypothetical performance results is that they are generally prepared with the benefit of hindsight. In addition, hypothetical trading does not involve financial risk, and no hypothetical trading record can completely account for the impact of financial risk of actual trading. for example, the ability to withstand losses or to adhere to a particular trading program in spite of trading losses are material points which can also adversely affect actual trading results. There are numerous other factors related to the markets in general or to the implementation of any specific trading program which cannot be fully accounted for in the preparation of hypothetical performance results and all which can adversely affect trading results.

Testimonial Disclosure: Testimonials appearing on this website may not be representative of other clients or customers and is not a guarantee of future performance or success.