
Teetering on the edge of a bear market

Key points:
- As of Friday's close, the S&P 500 had dropped more than 17% from its all-time high
- Similar corrections saw the large-cap index decline 67% of the time over the subsequent six months
- A 20% decline in the world's most benchmarked index often sets the stage for a bear market bounce
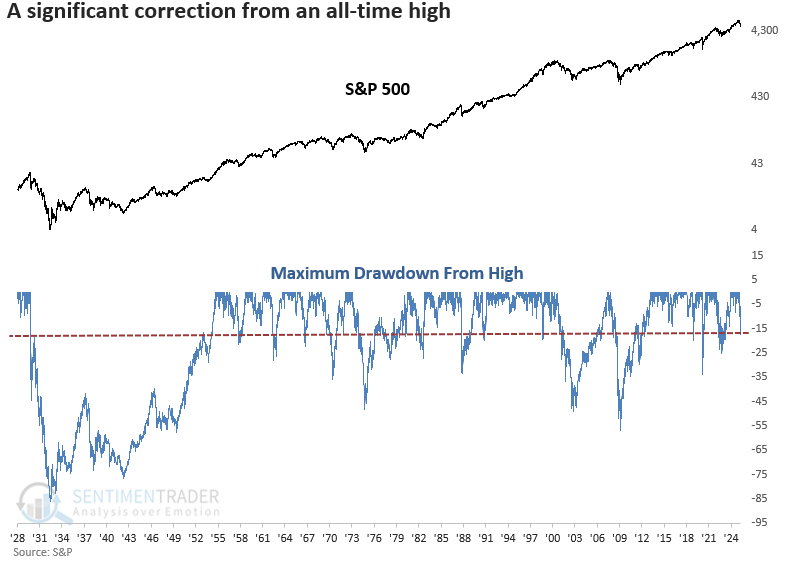
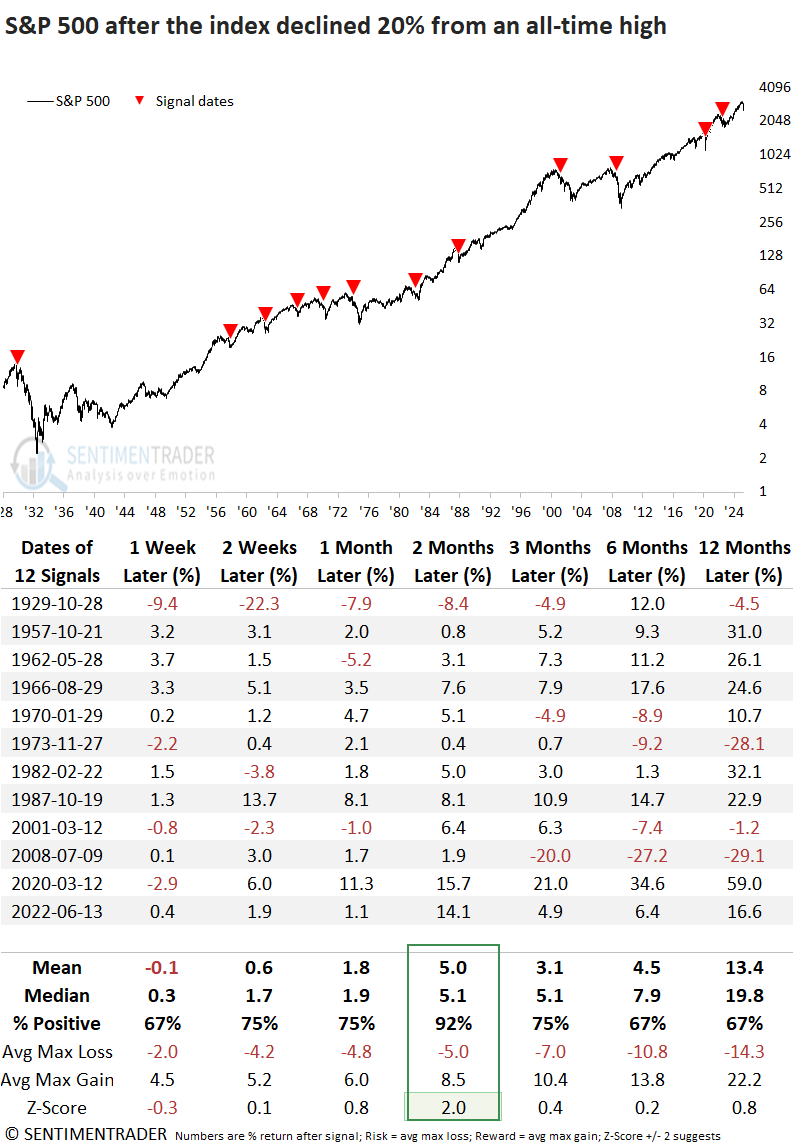
Significant corrections from an all-time high often signal the onset of a bear market
For only the 16th time since 1929, the S&P 500 has plunged over 15% from a record high, a feat achieved in just 32 trading sessions, marking the fifth-fastest decline in history. This rare and abrupt drop places the current market environment in a historically extreme category, underscoring the intensity of recent selling pressure. Sharp shifts in sentiment/positioning have typically driven such swift declines due to macro shocks.
The critical question for investors is whether the tariff tantrum could tip the economy into recession. Bear markets tied to recessions tend to suffer deeper declines than those without. Unfortunately, we can only confirm recessions in hindsight. As a result, the stock market itself may offer the best indication of an economic downturn.
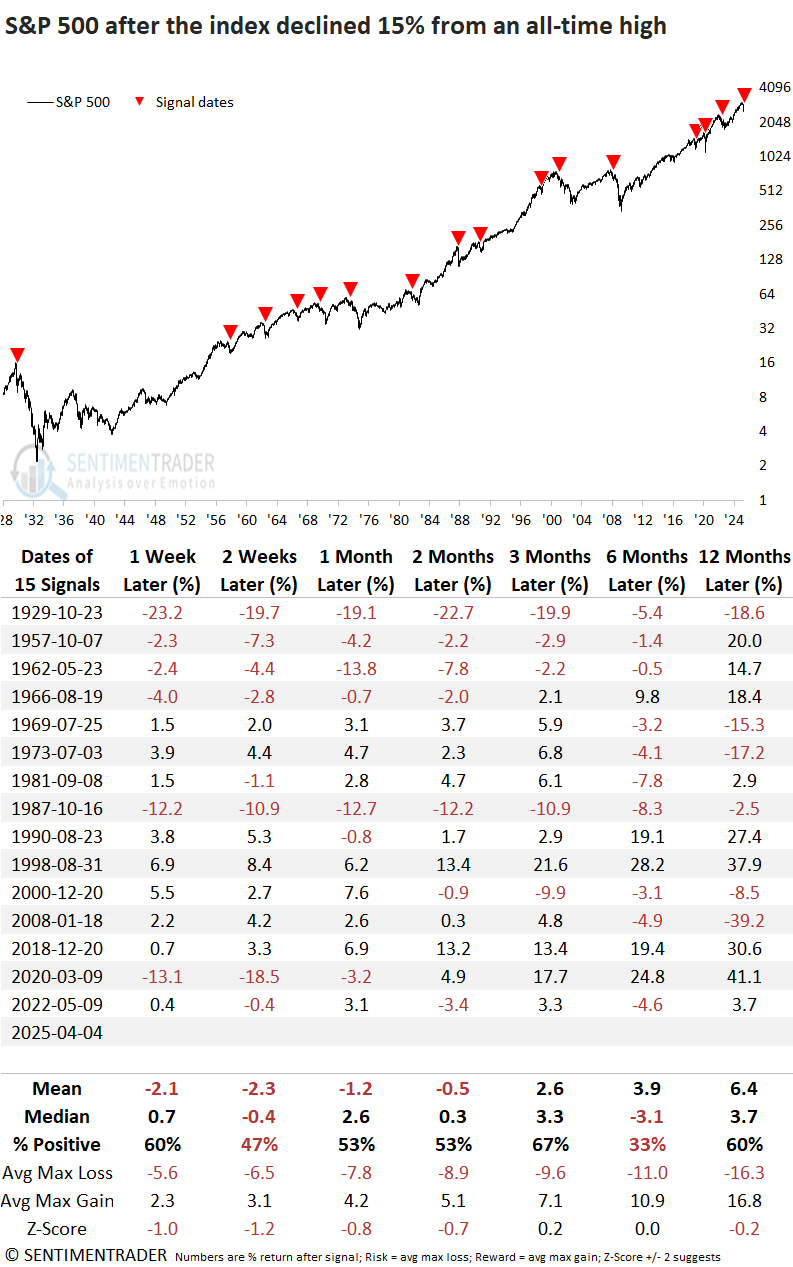
Similar drawdowns preceded an unfavorable outlook for the S&P 500
Although the S&P 500 had already endured a 15% decline from its peak, history offered little reason for optimism for someone wishing to buy the dip. Over the next six months, the index advanced just a third of the time, and downside risk generally outweighed upside reward across most time frames, with only a slight edge at the one-year mark.
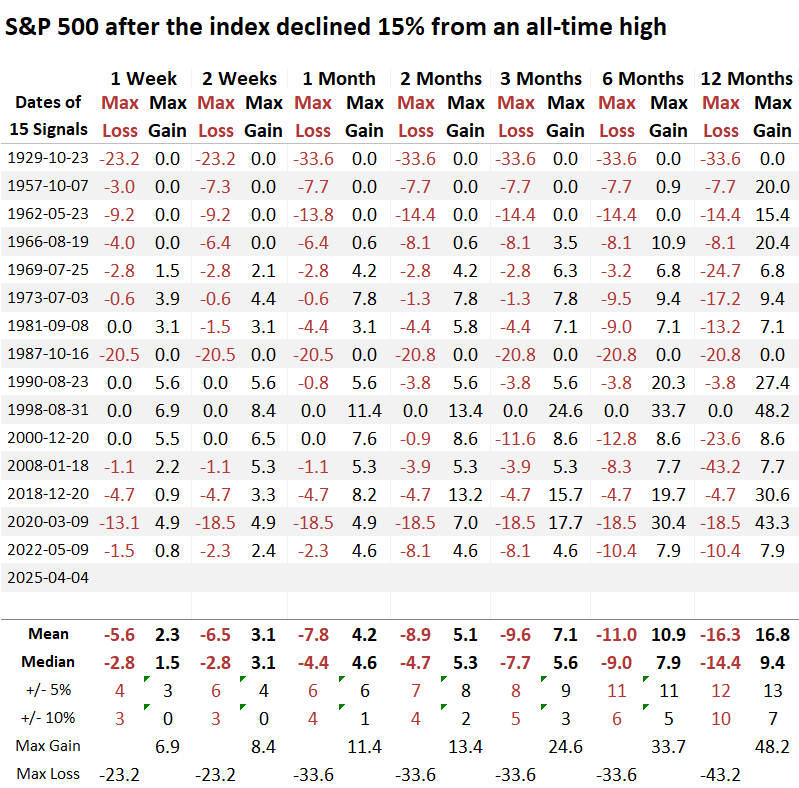
Over the following year, the maximum loss surpassed -10% in 10 out of 15 cases. By comparison, just 7 of 15 rose more than 10%, underscoring an unfavorable risk-reward profile.
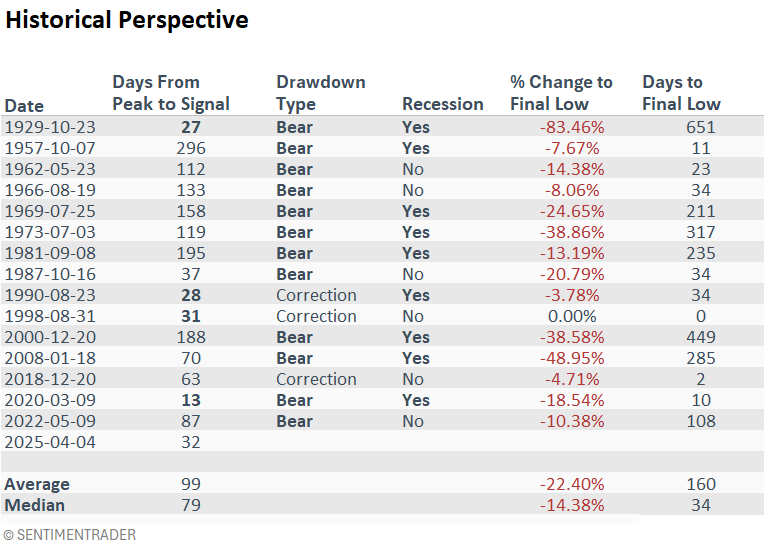
Not an encouraging sign
A 15% drawdown from an all-time high resulted in a bear market in 12 out of 15 instances. If the S&P 500 sidesteps a 20% decline, one potential silver lining is that past swift corrections, like those in 1990, 1998, and 2020, tended to bottom relatively quickly.
A potential relief rally scenario
If the S&P 500 were to decline by 20%, a commonly used threshold for a bear market, a relief rally lasting several months could follow. Historically, over the next two months, the S&P 500 has rebounded 92% of the time, with the sole exception being 1929.
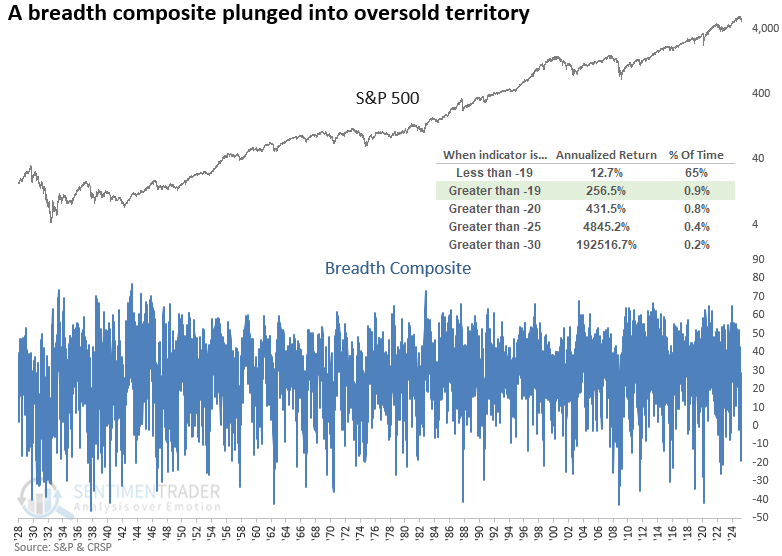
Oversold condition
As of Friday's close, my breadth composite dropped sharply to -19%, a level observed in less than 1% of all instances since 1928. After the market opened this morning, it had fallen even further to -26%. Historically, readings below -25% have produced powerful one-day rallies, resulting in an eye-popping 4845% annualized return for the S&P 500.
What the research tells us...
The S&P 500 is nearing bear market territory after falling over 15% from its all-time high. Historically, similar drawdowns have resulted in further declines 67% of the time over the next six months. Of the last 15 such instances, 12, or 80%, entered a bear market, defined as a 20% drop. The magnitude and duration of a bear market will ultimately depend on whether the US economy can avoid a recession. Suppose the index does fall by 20%. In that case, history also suggests the potential for a multi-month rebound, offering an opportunity for traders to play a bounce and a window for investors to adjust market exposure.