Products
SentimenTrader Trading Tools
‍
Backtest Engine
My Trading Toolkit
Correlation Analysis
Seasonality
Market Prediction
Indicators & Data API
‍
Proprietary Indicators & Charts
Market Data API
Strategies & Scanner
‍
50+ Trading Strategies
Smart Stock Scanner
Smart Option Scanner
Research Reports
‍
Research Solutions
Reports Library
Free Resources
Simple Backtest Calculator
Simple Seasonality Calculator
The Kelly Criterion Calculator
Sentiment Geo Map
Public Research Reports
Education
Sentiment Indicators
Technical Indicators
Pricing
Company
About
In the News
Testimonials
Client Success Stories
Contact
Log inLoginSign up
< BACK TO ALL REPORTS

Tech's massive swings signal a long-term change

Jason Goepfert
2021-03-18
Technology stocks have been swinging wildly relative to Industrial stocks. Over the past year, Tech has outperformed Industrials by 2% or more on 28 days, among the most in nearly 100 years. The 2 other instances ultimately led to Tech under-performing.

There has been a lot of rotation going on under the surface. We've touched on that in a few different ways, either looking at relative returns in indexes or factors like Growth versus Value (here and here).

Mark Hulbert, writing in Barron's, noted the Nasdaq's sudden snapback versus the Dow Industrials the other day. Once again, the Nasdaq surged relative to the Dow, adding to the count of outsized moves in recent months.

We certainly saw that at the top of the dot-com bubble. Over the three months prior to that top, there were no fewer than 14 trading sessions in which the Nasdaq's alpha over the Dow was at least two percentage points. No other three-month period over the past 50 years has seen as many large positive alphas between the two indexes.

Going back further, we can look at the daily changes in the total return in Technology versus Industrial stocks. The chart below shows a running count of how many days there were in the past year when Tech outperformed Industrials by 2% or more. We're only focusing on days when Tech outperformed by a large degree - it's a similar picture when including 2% gains or losses.

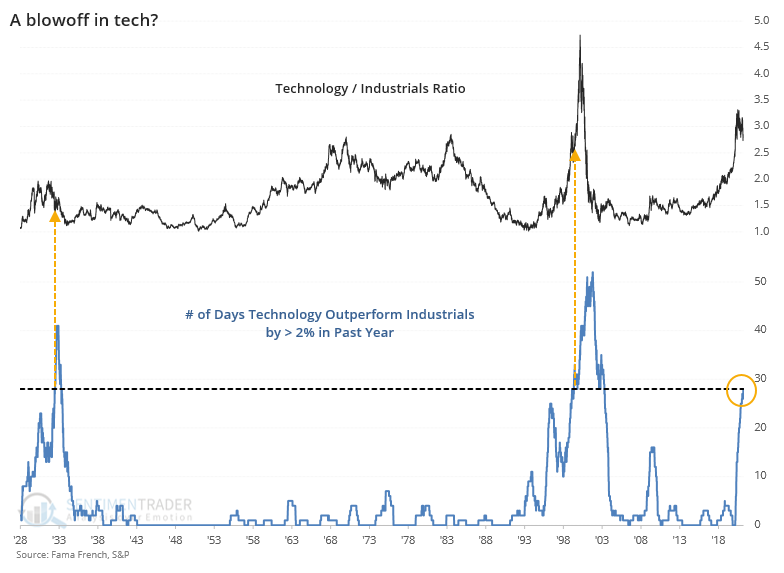
This was not a precise signal. It triggered after the peak between Technology and Industrials in the 1930s, and well before the peak in 1999. The table below shows forward returns for the S&P 500 and the relevant factors once this reached the current level of 28 days.

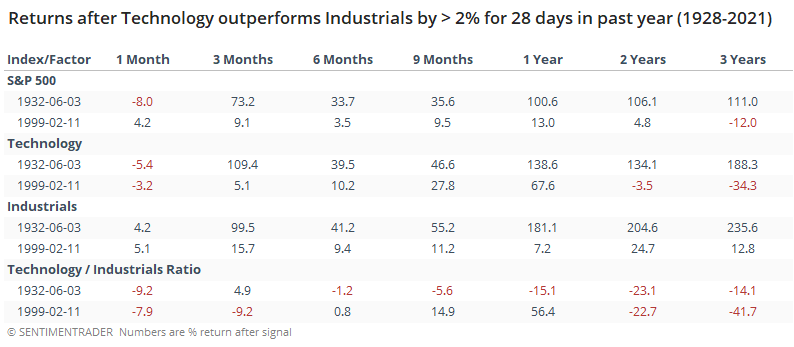
While it wasn't a good timing signal, the overriding message was clear, or at least as clear as it can be with a sample size of 2. Over the next 2-3 years, Technology greatly under-performed Industrials. This is much more of an environmental clue as opposed to any kind of actionable timing signal. It's another hint that the severe rotations among indexes, sectors, and factors in recent weeks and months are signaling a turn in long-term trends.

PRODUCTS
SentimenTrader
Trading Tools
Indicators & Data API
‍
Strategies & Scanner
‍
Research Reports
FREE
RESOUrCES
Simple Backtest
Calculator
Simple Seasonality
Calculator
The Kelly Criterion
Calculator
Sentiment Geo Map
‍
Public Research Reports
‍
Education
Sentiment Indicators
‍
Technical Indicators
‍
Pricing
Bundle pricing
‍
FAQ
‍
Announcements
‍
COMPANY
‍
About
‍
In the News
‍
Testimonials
‍
Client Success Stories
CONTACT
‍
General Inquiries
‍
Media Inquiries
‍
Financial Professionals Inquiries
‍
© 2026 Sundial Capital Research Inc. All rights reserved.
Setsail Marketing
TermsPrivacyAffiliate Program
Risk Disclosure: The information and tools provided are for research and analytical purposes only and are not intended as investment advice. Market analysis involves uncertainty, and outcomes may differ from expectations. Users should conduct their own due diligence and consider their individual circumstances before making any financial decisions. Past performance is not necessarily indicative of future results.

Hypothetical Performance Disclosure: Hypothetical performance results have many inherent limitations, some of which are described below. No representation is being made that any account will or is likely to achieve profits or losses similar to those shown; in fact, there are frequently sharp differences between hypothetical performance results and the actual results subsequently achieved by any particular trading program. One of the limitations of hypothetical performance results is that they are generally prepared with the benefit of hindsight. In addition, hypothetical trading does not involve financial risk, and no hypothetical trading record can completely account for the impact of financial risk of actual trading. for example, the ability to withstand losses or to adhere to a particular trading program in spite of trading losses are material points which can also adversely affect actual trading results. There are numerous other factors related to the markets in general or to the implementation of any specific trading program which cannot be fully accounted for in the preparation of hypothetical performance results and all which can adversely affect trading results.

Testimonial Disclosure: Testimonials appearing on this website may not be representative of other clients or customers and is not a guarantee of future performance or success.