
Technology triggers an optimism index buy signal

Key points
- Amid a sharp decline in the broader market, the technology sector has triggered a SentimenTrader Optimism Index (Optix) buy signal.
- When this pessimistic Optix signal aligns with a Composite Washout Model reading of 22% or higher, the XLK ETF historically boasts an 87% win rate over a three-month timeframe.
- However, the percentage of S&P 500 tech stocks with their 50-day moving average above their 150-day moving average just dropped below 38, signaling significant structural weakness beneath the surface.
Should we rent Technology for a mean reversion trade
With the recent sharp decline in the broader market indexes, we have been looking for mean-reversion bounce opportunities. The SentimenTrader Optix is one of the indicators used to monitor buy and sell signals based on a swing trading model. The Optimism Index (Optix) for ETFs is based on data including:
- Trading activity in put options versus call options
- Future volatility expectations
- Average discount of the fund to its NAV
- Price behavior
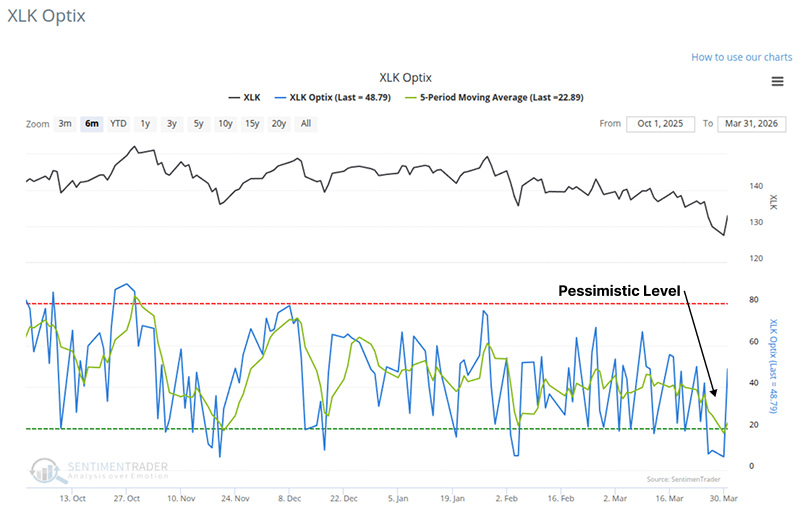
Technology has been one of the hardest-hit sectors, but it triggered an Optix buy signal on Monday.
A trading model to identify Optimism Index reversals
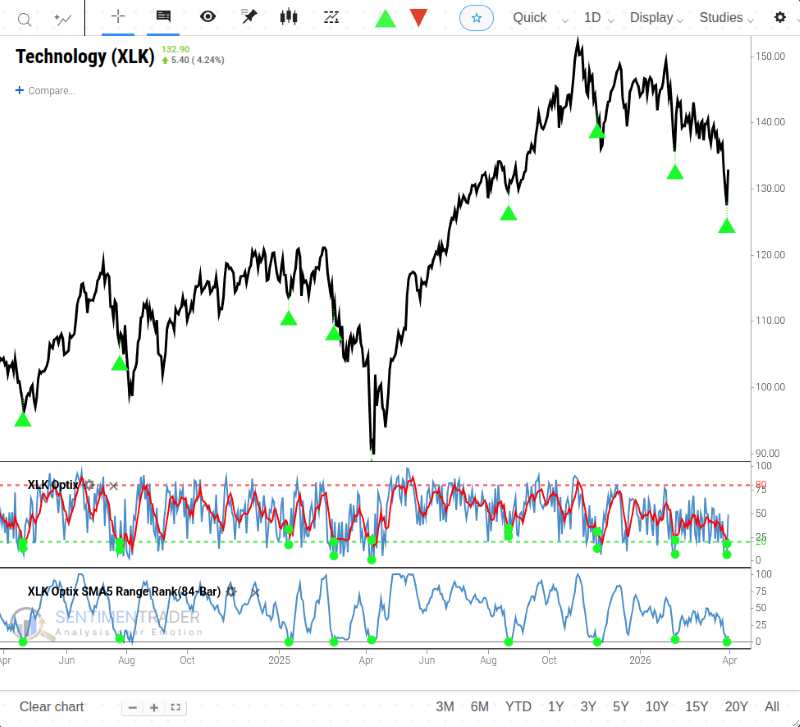
This model applies an 84-day range rank to the 5-day moving average of the XLK ETF's Optimism Index. The range rank indicator measures the relative position of the current value compared to all other values over the lookback period, with 100 being the highest and 0 the lowest. A new pessimistic buy signal is triggered when the Optix range rank drops below the 5th percentile.
The Technology ETF (XLK) rallied 61% of the time after other signals
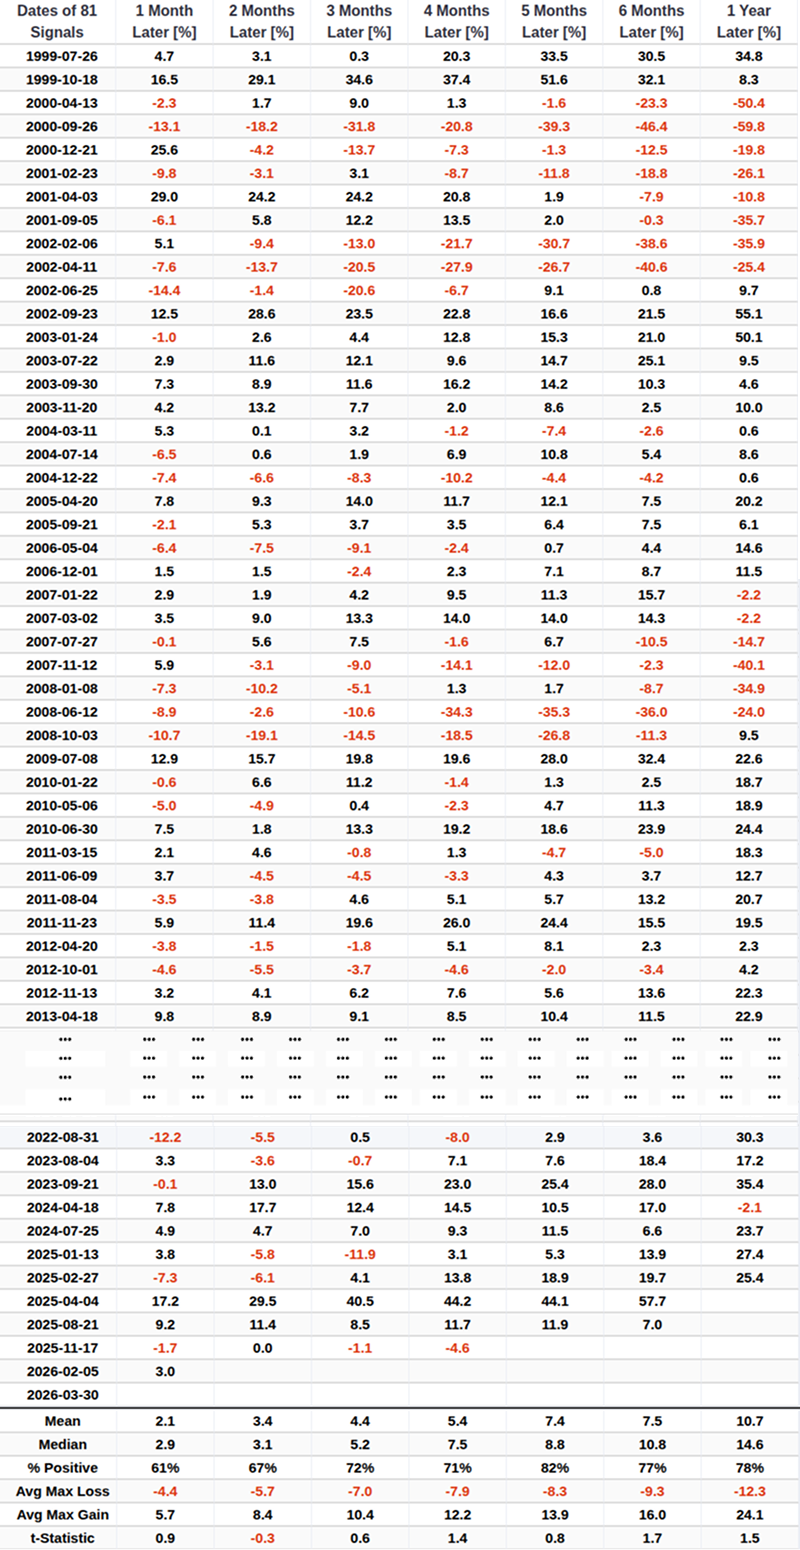
Since the inception of the Optix index in 1999, the optimism trading model for the XLK ETF has flashed 81 alerts. While the results are robust across all timeframes, the model naturally performs better during uptrends. The most severe drawdowns for these trades occurred during massive bear markets, such as the Dot-Com bubble and the Global Financial Crisis.
In a bull market, the goal is to buy the dip during oversold or pessimistic conditions. In a bear market, this strategy can lead to losses, as the 2022 signals clearly demonstrated. However, when a technology Optix alert occurs simultaneously with a Composite Washout Model signal count of 22% or greater (meaning at least two of the nine sub-models in the Composite Washout Model have triggered), the results significantly outperform standalone alerts.
Context is important. Therefore, let's isolate the technology Optix signals that triggered when the Composite Washout Model count was at or above 22%, which perfectly aligns with our current setup. For related backtest, click here.
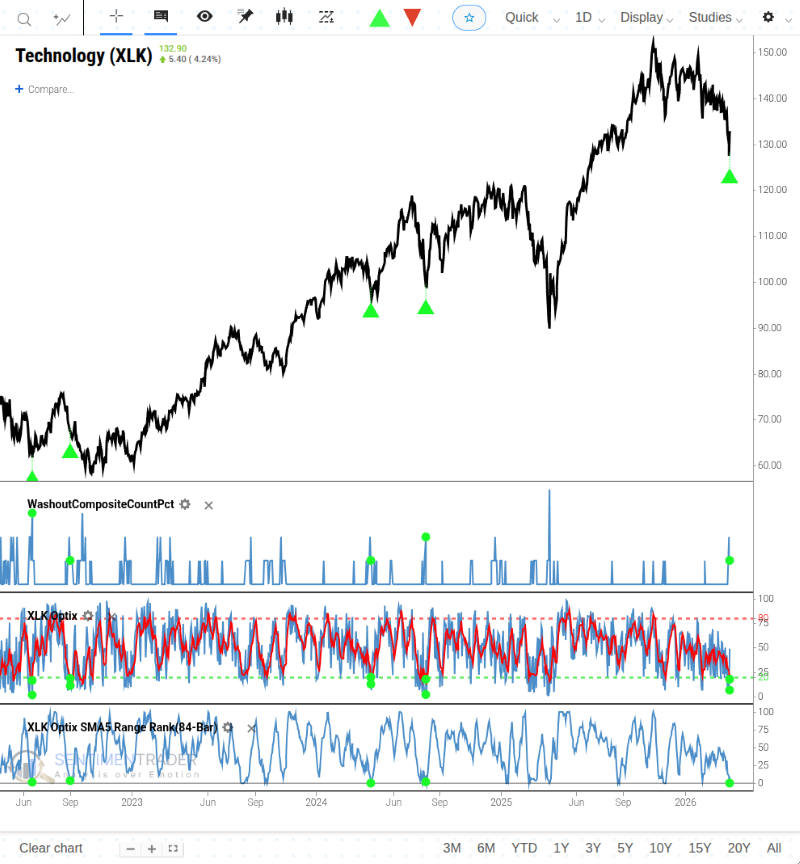
Although the sample size is small, the medium-to-long-term results are outstanding. Over a three-month timeframe, it boasts an 87% win rate and a median return of 8.9%.
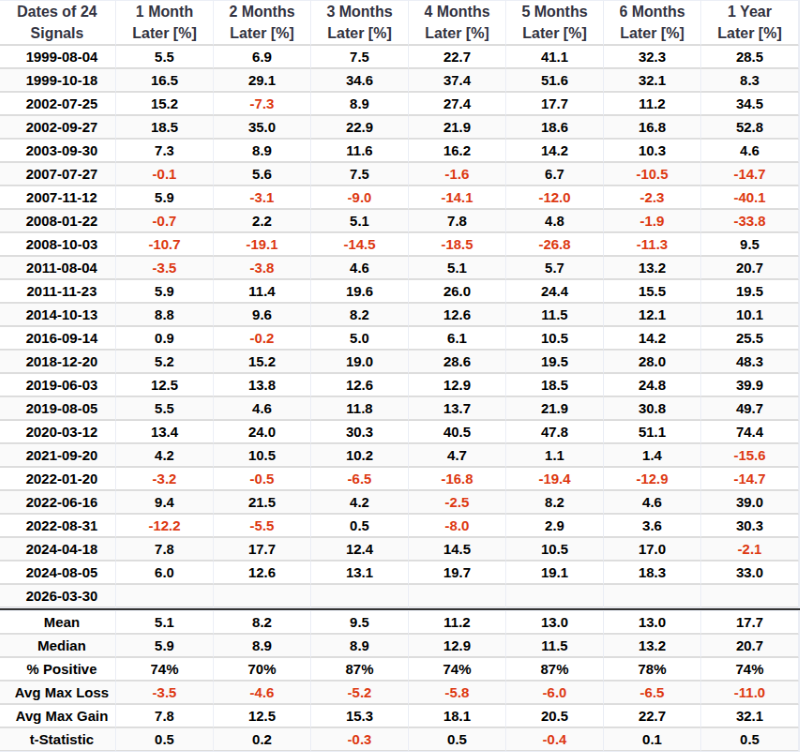
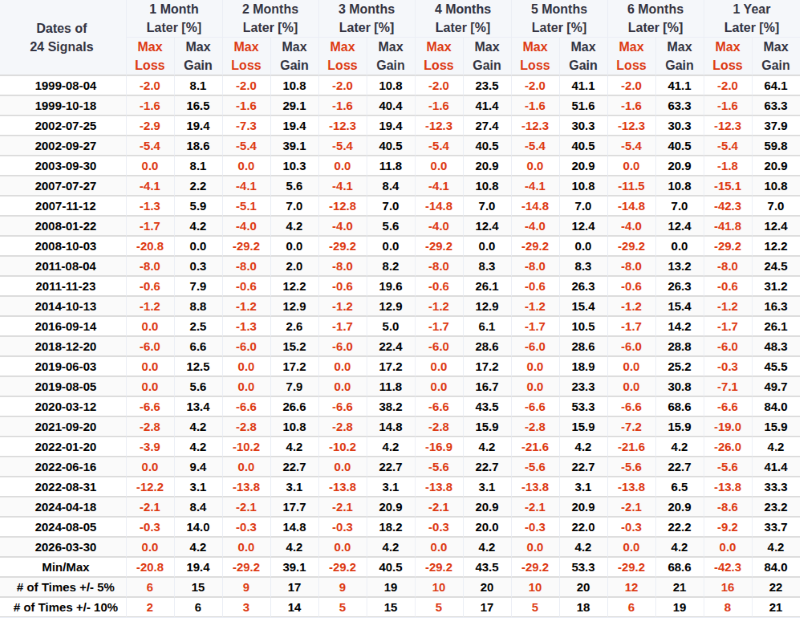
Across almost all timeframes, the magnitude and frequency of maximum gains eclipse maximum drawdowns.
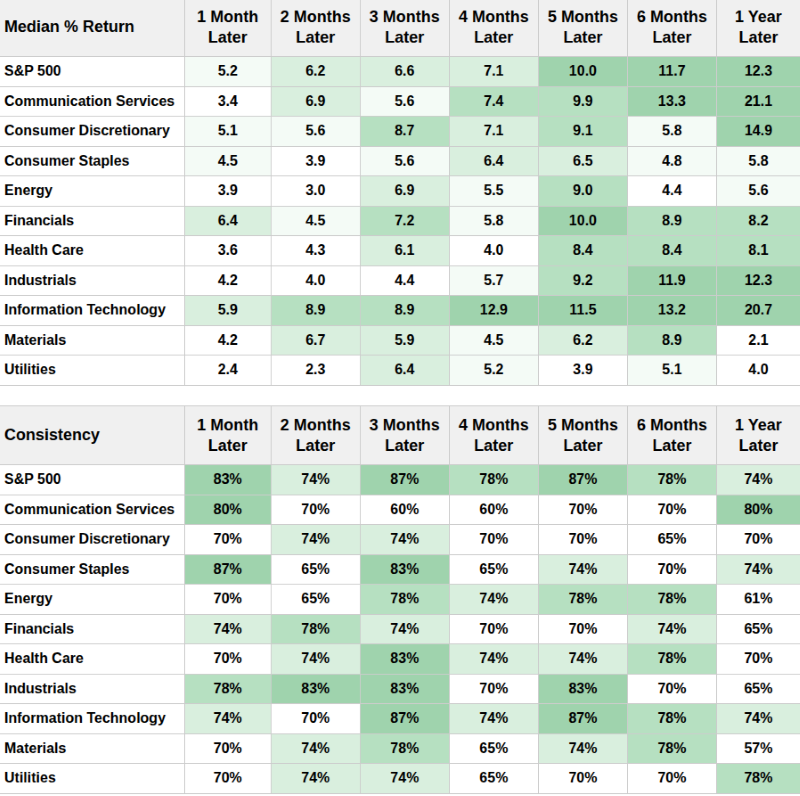
Following the signal, the technology sector tends to outperform the broader market, and cyclical sectors outpace traditional defensive ones.
A significant big-picture risk for Technology stocks
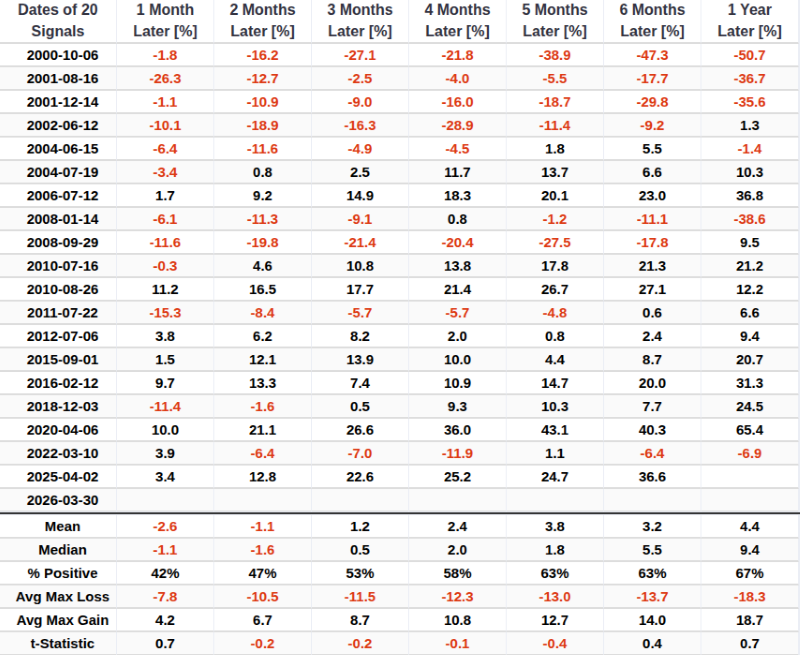
On Monday, the percentage of S&P 500 technology stocks with their short-to-medium-term average (50-day MA) above their long-term average (150-day MA) dropped below 38. While this is a relatively rare occurrence, it is undeniably a major red flag signaling structural weakness beneath the sector's surface.
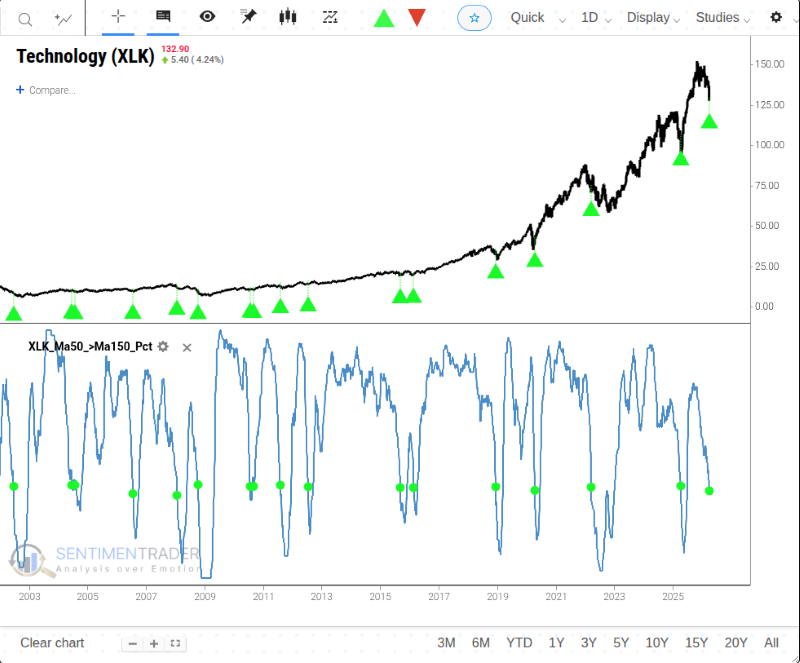
Historically, after this breadth metric breaks below 38, the longer-term outcomes are generally favorable. However, we must respect the overarching risk environment: the win rate drops below 50% over the immediate one-to-two-month timeframe.
What the research tells us...
At times, when the market has fallen too far, mean-reversion trading strategies may actually prove effective. Extreme market pessimism has triggered an Optix buy signal, and historically, when such a signal coincides with a Composite Washout reading, it often leads to a high-return rally lasting several months. Therefore, the previously battered technology sector may present an entry point for a rebound. However, keep in mind that the overall risk in this sector remains high. Deteriorating market breadth-with the 50-day/150-day moving average crossover falling below 38%-signals potential weakness.