
Technology triggers an optimism index buy signal

Key points:
- A trading model that uses the Optimism Index triggered a new buy signal for Technology
- The XLK ETF has rallied 68% of the time a month later after other alerts
- Signals that occurred with a Composite Washout Model count of >= 50% show strong results
Should we rent Technology for a mean reversion trade
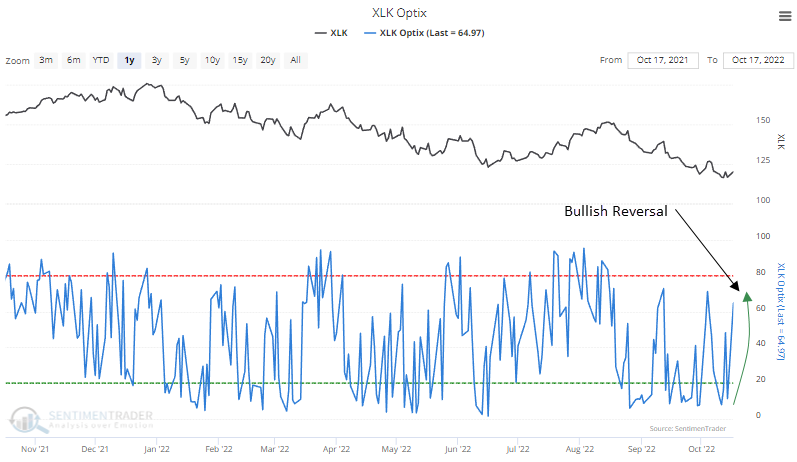
With a Composite Washout Model signal triggering last week, I've been searching for trade ideas to play a mean reversion bounce. The SentimenTrader Optimism Index is one indicator I monitor for buy and sell signals based on a model I developed for swing trades.
Technology, one of the most beaten down sectors, triggered an Optimism Index buy signal on Monday. The sector is the first and only group to initiate an alert since last week's new low in the S&P 500.
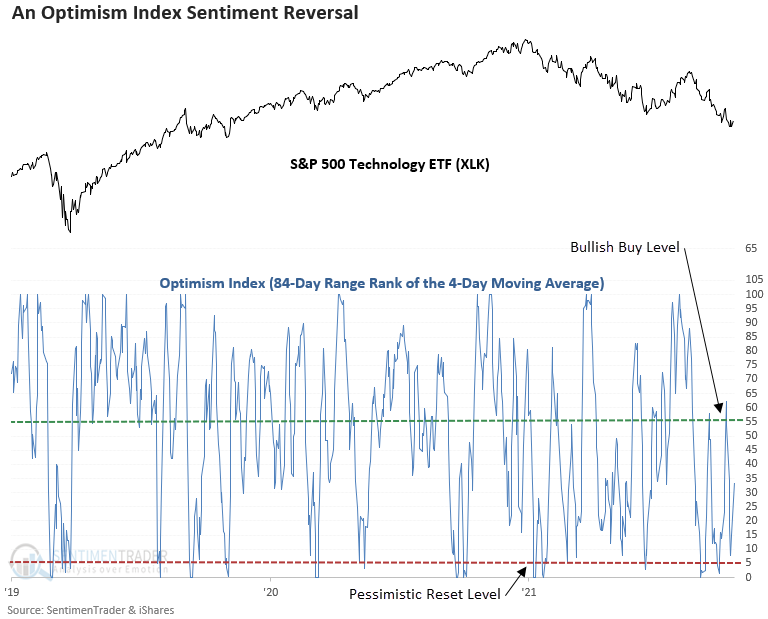
A trading model that identifies a reversal in the Optimism Index
The model applies an 84-day range rank to the 4-day moving average of the Optimism Index for the XLK ETF. The range rank indicator measures the current value relative to all other values over a lookback period. 100 is the highest, and 0 is the lowest. The pessimistic reset condition occurs when the range rank for the Optix Index crosses below the 5th percentile. A new buy signal triggers when the range rank exceeds the 55th percentile and ETF momentum turns positive.
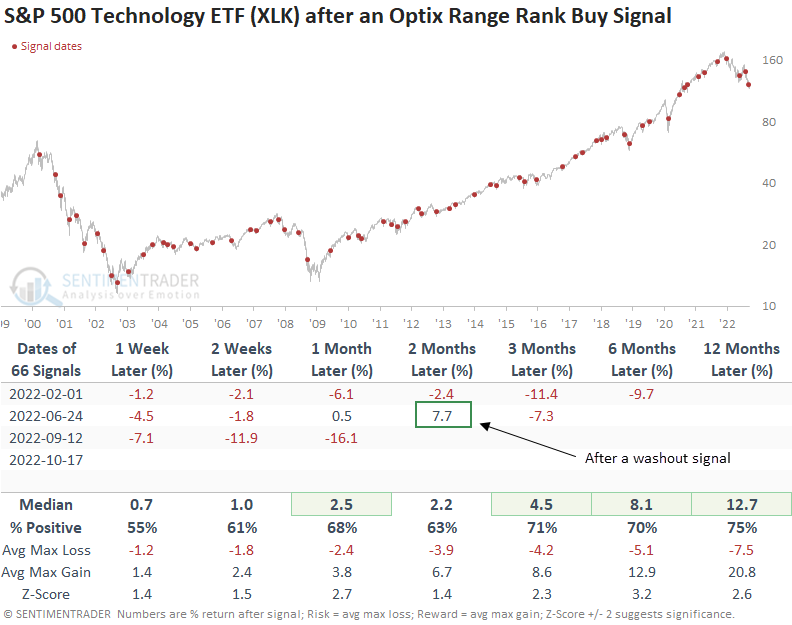
The Technology ETF (XLK) rallied 68% of the time after other signals
The Optimism Index trading model for the XLK ETF has generated an alert 66 other times since the creation of the Optix index in 2000. While results are solid across all time frames, the model performs better in uptrends.
In bull markets, the goal is to buy reversals from oversold or pessimistic conditions. In bear markets, that type of strategy can be painful, as the 2022 signals clearly show. However, suppose the broad market is highly oversold, which is the case now. In that environment, one can rent a beaten sector like Technology.
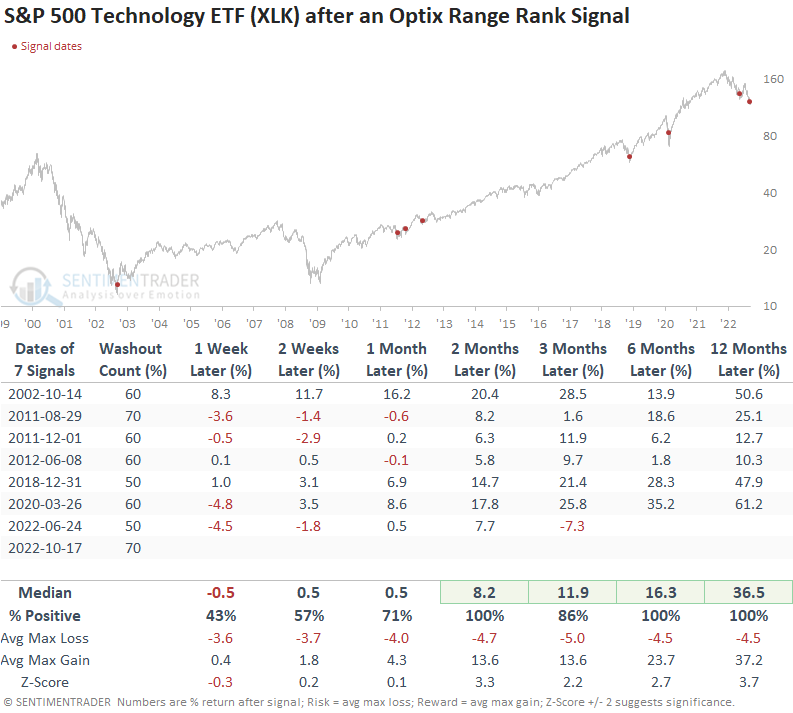
The June 2022 Optimism Index alert for Technology occurred alongside a Composite Washout Model signal, and the results were significantly better than the non-washout alerts.
Context is important. So, let's isolate Optimism Index signals for the Technology sector that triggered an alert when the Composite Washout Model signal count was >= 50%, which is the case now.
While the sample size is small, the results look excellent across medium to long-term time frames. The 1-week results show that anything can happen in the near term, especially in volatile drawdown phases.
A significant big-picture risk for Technology stocks
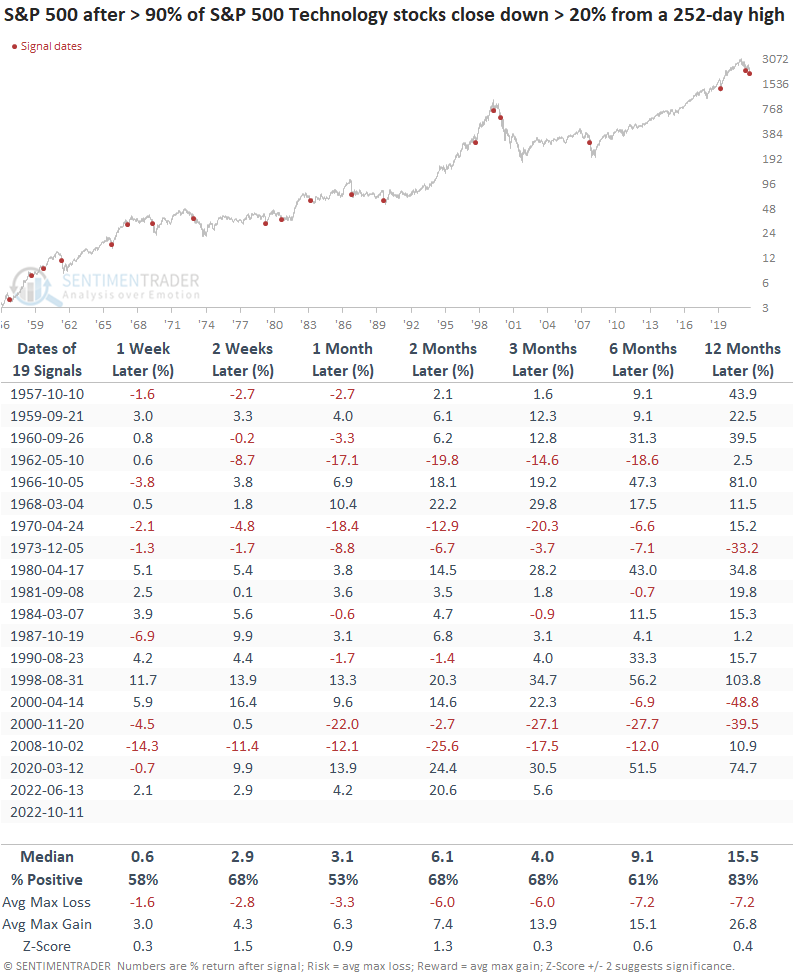
The percentage of S&P 500 Technology stocks down > 20% from a 252-day high exceeded 90% for the second time in the current bear market last week. While rare, an additional signal is a major red flag. The previous multi-signal instance occurred during the Dotcom bear market.
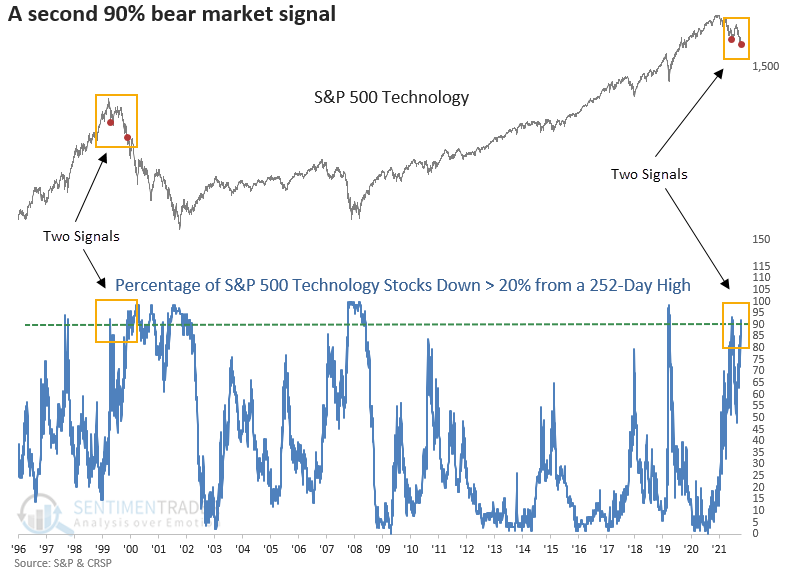
While results are generally favorable after more than 90% of technology stocks enter a bear market, the signal can be early, which was the case in 1962, 1970, 1973, 2008, and 2000. And, even though a second signal is rare, we must be mindful of the big-picture risk.
What the research tells us...
Stocks remain entrenched in a bear market, and buy-the-dip trading strategies struggle in this environment. Sometimes, markets become so stretched to the downside that a mean reversion trade makes sense. With a Composite Washout Model alert signaling a potential counter-trend rally for stocks and a new Optimism Index signal for Technology, the beaten-down sector could be one way to play a bounce. Remember, one should consider a short-term rental as the big-picture risk remains high for the industry, with many stocks in a bear market.