Products
SentimenTrader Trading Tools
‍
Backtest Engine
My Trading Toolkit
Correlation Analysis
Seasonality
Market Prediction
Indicators & Data API
‍
Proprietary Indicators & Charts
Market Data API
Strategies & Scanner
‍
50+ Trading Strategies
Smart Stock Scanner
Smart Option Scanner
Research Reports
‍
Research Solutions
Reports Library
Free Resources
Simple Backtest Calculator
Simple Seasonality Calculator
The Kelly Criterion Calculator
Sentiment Geo Map
Public Research Reports
Education
Sentiment Indicators
Technical Indicators
Pricing
Company
About
In the News
Testimonials
Client Success Stories
Contact
Log inLoginSign up
< BACK TO ALL REPORTS

Technology shows more signs of short-term exhaustion

Dean Christians
2024-06-24
For only the 13th time since 1957, the S&P 500 Technology sector registered a multi-month relative high versus the S&P 500 in 13 out of 21 sessions. Similar relative trend breakouts often signaled price exhaustion, resulting in a short-term consolidation. Over longer horizons, traders who bought the dip benefitted as the prevalence of a signficant number of relative highs was typically associated with a secular theme in Technology.

Key points:

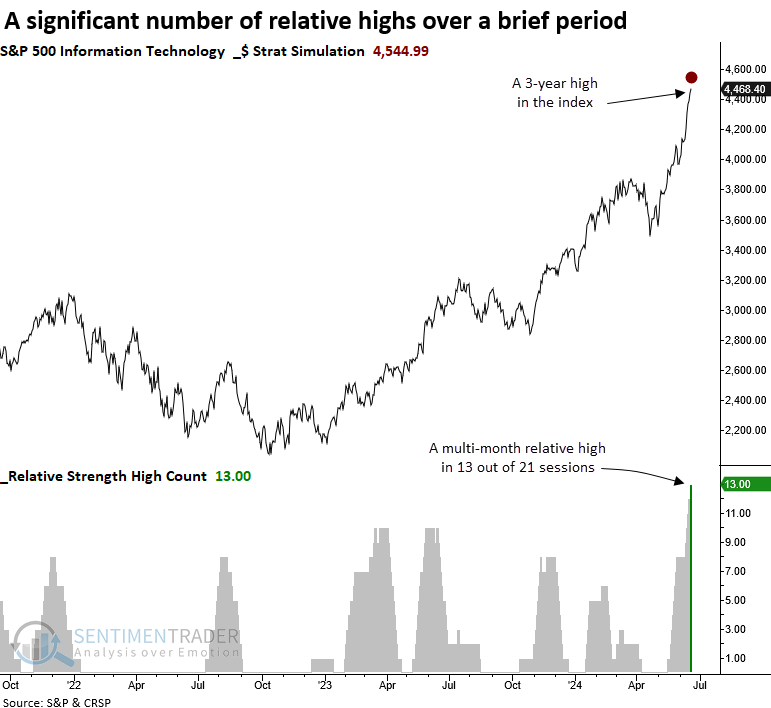
  • Over the last month, the S&P 500 Technology sector has registered 13 multi-month relative highs
  • Similar periods with a significant number of relative highs suggest near-term exhaustion for the sector
  • Investors should not lose sight of the big picture, as an abundance of relative highs is typically bullish long-term

Relative trends for Technology suggest a pause that refreshes a bullish trend 

Last week, I highlighted the overbought condition in the S&P 500 Technology sector by comparing the group to a short-and long-term moving average, which suggested near-term price exhaustion. i.e., the sector has gone up too far too fast.

Price exhaustion can also be measured relative to a benchmark like the S&P 500, indicating that a sector or stock exhibits significant relative momentum versus a broad basket of stocks.

Over the last month, the S&P 500 Technology sector registered a multi-month relative high versus the S&P 500 in 13 out of 21 sessions, a phenomenon that has only occurred 13 other times since 1957 when including a condition requiring a 3-year absolute high for the sector. 

Similar relative trends suggest that Technology could struggle in the near term

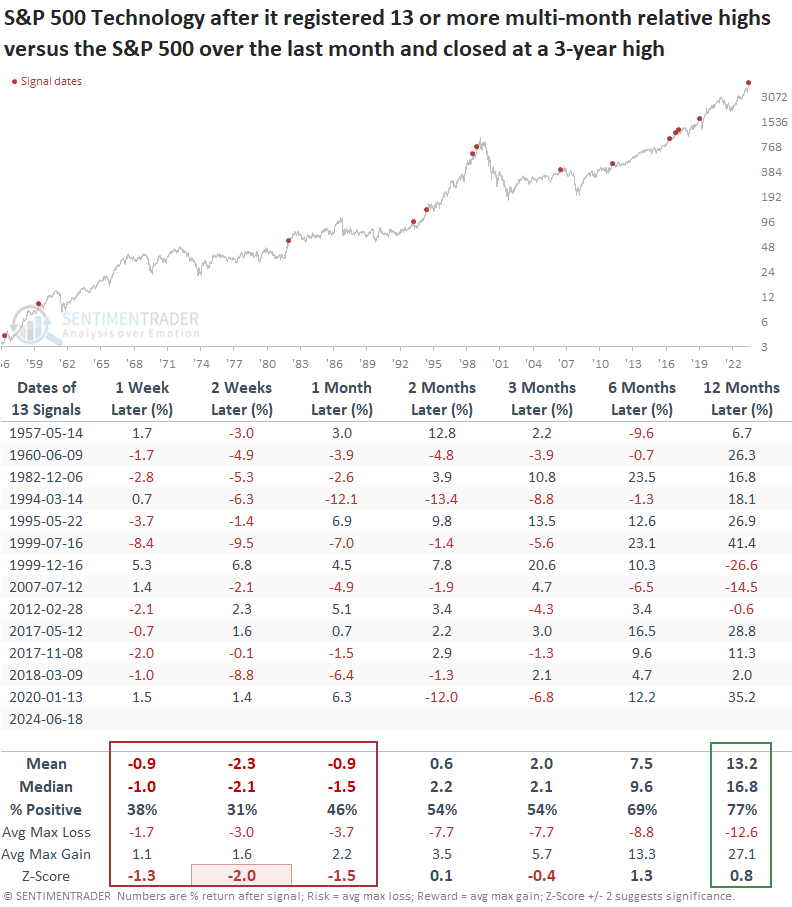
Whenever the S&P 500 Technology sector registered 13 or more multi-month relative highs versus the S&P 500 in 21 sessions and simultaneously closed at a 3-year high, it tended to struggle over the following month, with 11 out of 13 instances showing a loss at some point during that period. Additionally, over the subsequent three months, the median maximum loss exceeded the maximum gain in each time horizon.

Suppose stocks are not approaching a market peak like those observed in December 1999 or July 2007. In that case, the long-term outlook indicates that investors should treat any pause as a typical consolidation within a bull market. 

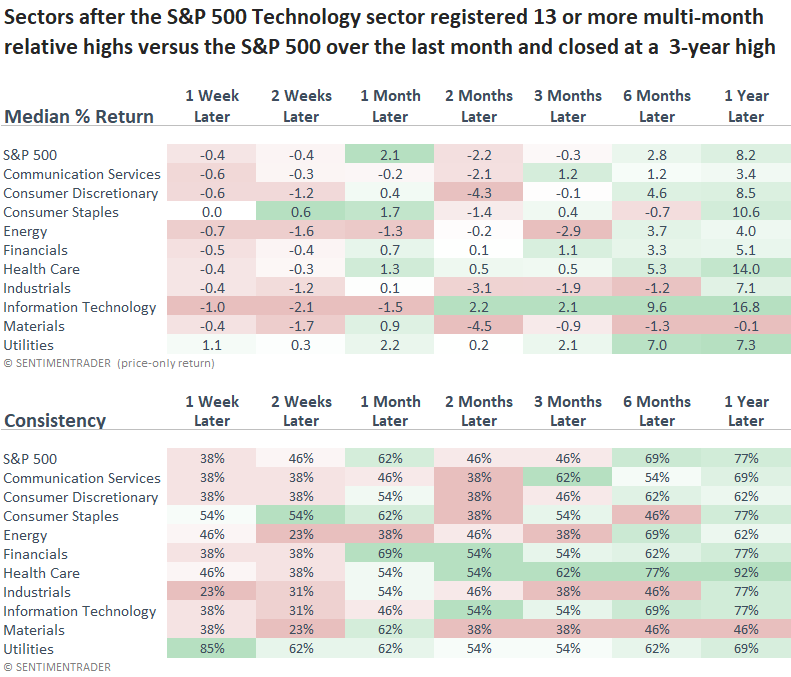
While Technology faced challenges over the ensuing month after hitting numerous relative highs in quick succession, defensive sectors such as Staples, Health Care, and Utilities displayed gains and relative outperformance versus cyclical sectors. Nonetheless, a year later, the S&P 500 Technology sector emerged as the top performer, indicating that long-term investors concentrating on the current innovation theme, AI, need not panic during a potential pullback. 

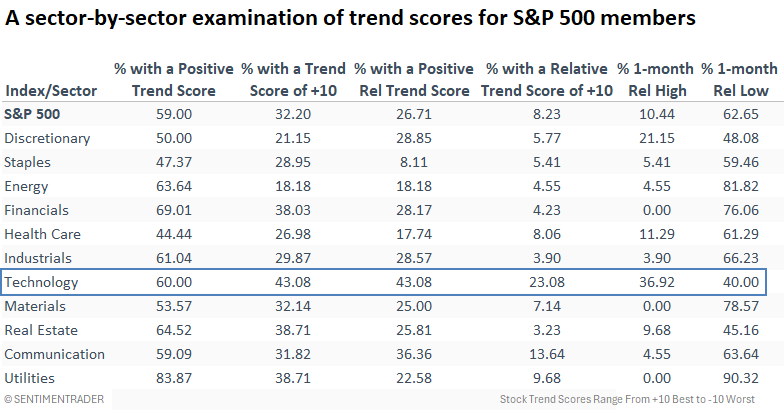
Absolute and Relative Trend Scores

The absolute and relative trend scores, which gauge medium- to long-term trends, remain positive for the Technology sector. Nevertheless, a higher percentage of stocks are hitting one-month relative lows compared to relative highs against the S&P 500, though the difference is slight. 

This phenomenon underscores a split market even within the leading sector. 

What the research tells us...

The S&P 500 Technology sector has recorded numerous multi-month relative highs against the S&P 500 over the last month. Historically, when a stock or sector experiences significant outperformance in a short period, it typically consolidates these gains by pulling back in a bullish consolidation pattern. Currently, the Technology sector is in such a scenario. Traders should exercise caution in the near term as choppy market conditions could prove frustrating. Long-term investors, however, should refrain from panicking as the overall outlook remains constructive. 

PRODUCTS
SentimenTrader
Trading Tools
Indicators & Data API
‍
Strategies & Scanner
‍
Research Reports
FREE
RESOUrCES
Simple Backtest
Calculator
Simple Seasonality
Calculator
The Kelly Criterion
Calculator
Sentiment Geo Map
‍
Public Research Reports
‍
Education
Sentiment Indicators
‍
Technical Indicators
‍
Pricing
Bundle pricing
‍
FAQ
‍
Announcements
‍
COMPANY
‍
About
‍
In the News
‍
Testimonials
‍
Client Success Stories
CONTACT
‍
General Inquiries
‍
Media Inquiries
‍
Financial Professionals Inquiries
‍
© 2026 Sundial Capital Research Inc. All rights reserved.
Setsail Marketing
TermsPrivacyAffiliate Program
Risk Disclosure: The information and tools provided are for research and analytical purposes only and are not intended as investment advice. Market analysis involves uncertainty, and outcomes may differ from expectations. Users should conduct their own due diligence and consider their individual circumstances before making any financial decisions. Past performance is not necessarily indicative of future results.

Hypothetical Performance Disclosure: Hypothetical performance results have many inherent limitations, some of which are described below. No representation is being made that any account will or is likely to achieve profits or losses similar to those shown; in fact, there are frequently sharp differences between hypothetical performance results and the actual results subsequently achieved by any particular trading program. One of the limitations of hypothetical performance results is that they are generally prepared with the benefit of hindsight. In addition, hypothetical trading does not involve financial risk, and no hypothetical trading record can completely account for the impact of financial risk of actual trading. for example, the ability to withstand losses or to adhere to a particular trading program in spite of trading losses are material points which can also adversely affect actual trading results. There are numerous other factors related to the markets in general or to the implementation of any specific trading program which cannot be fully accounted for in the preparation of hypothetical performance results and all which can adversely affect trading results.

Testimonial Disclosure: Testimonials appearing on this website may not be representative of other clients or customers and is not a guarantee of future performance or success.