
Technology reaches one of the most overbought conditions in history

Key points:
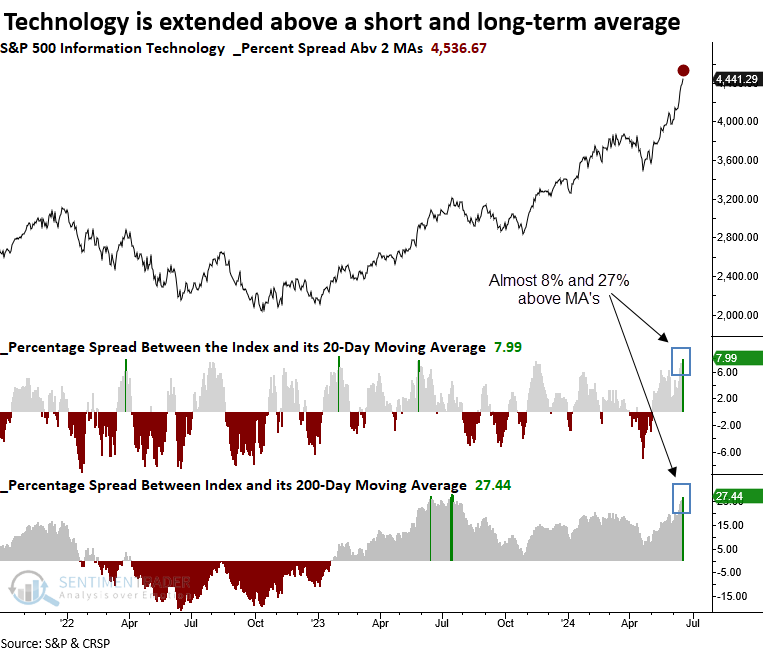
- Momentum in Technology has pushed the sector significantly above a short and long-term average
- Similar overbought conditions preceded an unfavorable outlook for Technology over the subsequent month
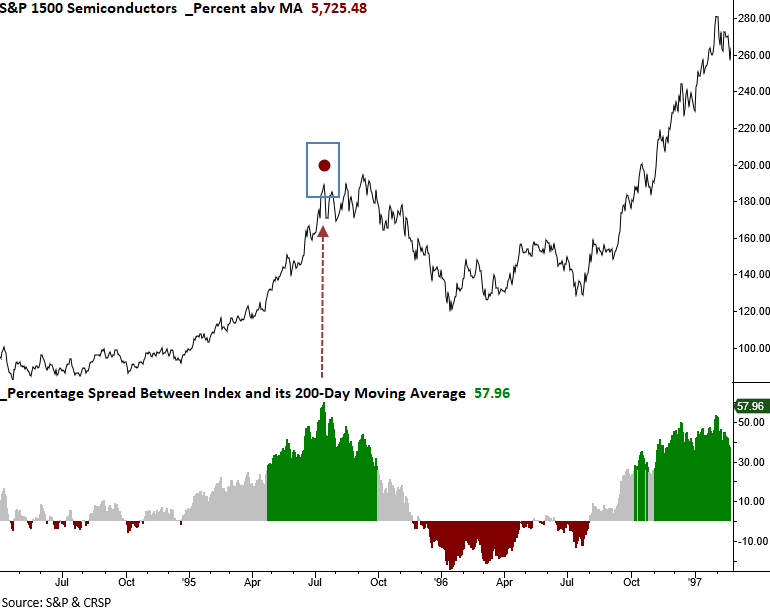
- A semiconductor index closed 60% above its 200-day average, a milestone achieved only a few other times
Should we be concerned about the overbought condition in the Technology sector?
Leadership has dwindled to only a few sectors, and Technology, one of the prominent players, might have advanced too rapidly.
Over the past month, the S&P 500 Technology sector has surged, fueled by demand for AI stocks, especially in the semiconductor industry. This positive price momentum has propelled the sector well above its 20 and 200-day moving averages, a feat achieved only 13 other times in history when excluding repeat occurrences.
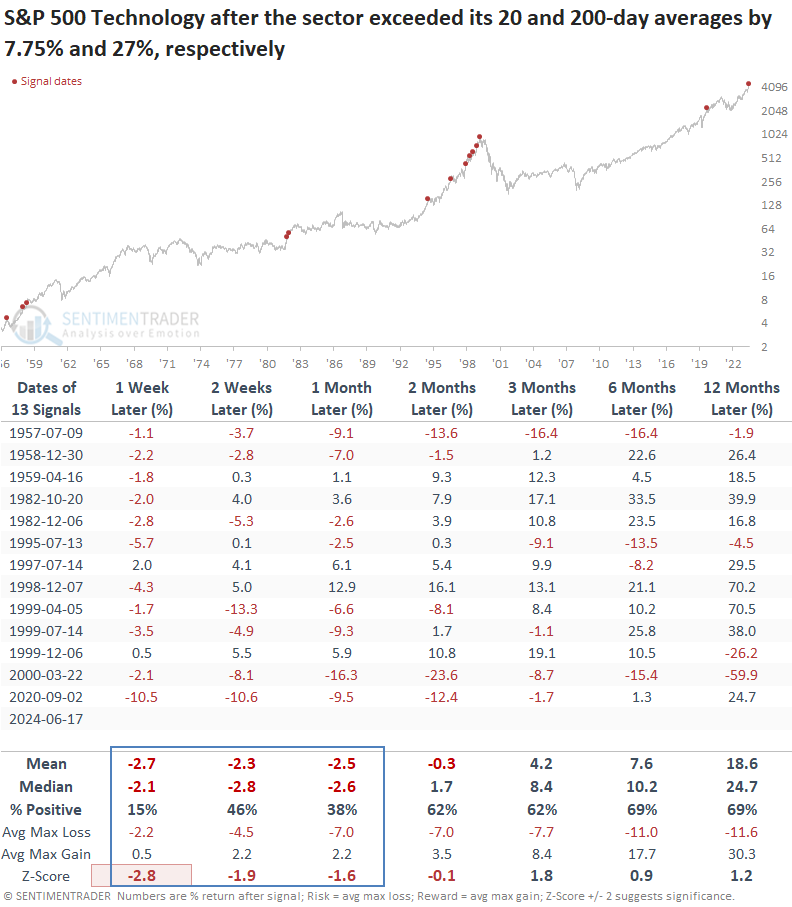
The previous instance occurred in September 2020, leading to a 12% decline over the following two months.
The moving average levels do not hold any particular significance; it was merely an observation.
Similar overbought conditions suggest that Technology could struggle in the near term
Whenever the S&P 500 Technology sector has simultaneously closed 7.75% above its 20-day average and 27% above its 200-day average, it tended to struggle over the following month, with 11 out of 13 instances showing a loss at some point during that period. The long-term results suggest a pause that refreshes a bullish trend.
Even during the Dotcom era, when technology stocks relentlessly surged year after year, 5 out of 7 precedents experienced a loss at some point in the first month, underscoring that no asset rises in a straight line forever.
If you expect the Fed to orchestrate a soft-landing like in 1995, remember that losses followed six and twelve months later in that scenario. Markets can occasionally discount all positive news and go through a digestion phase.
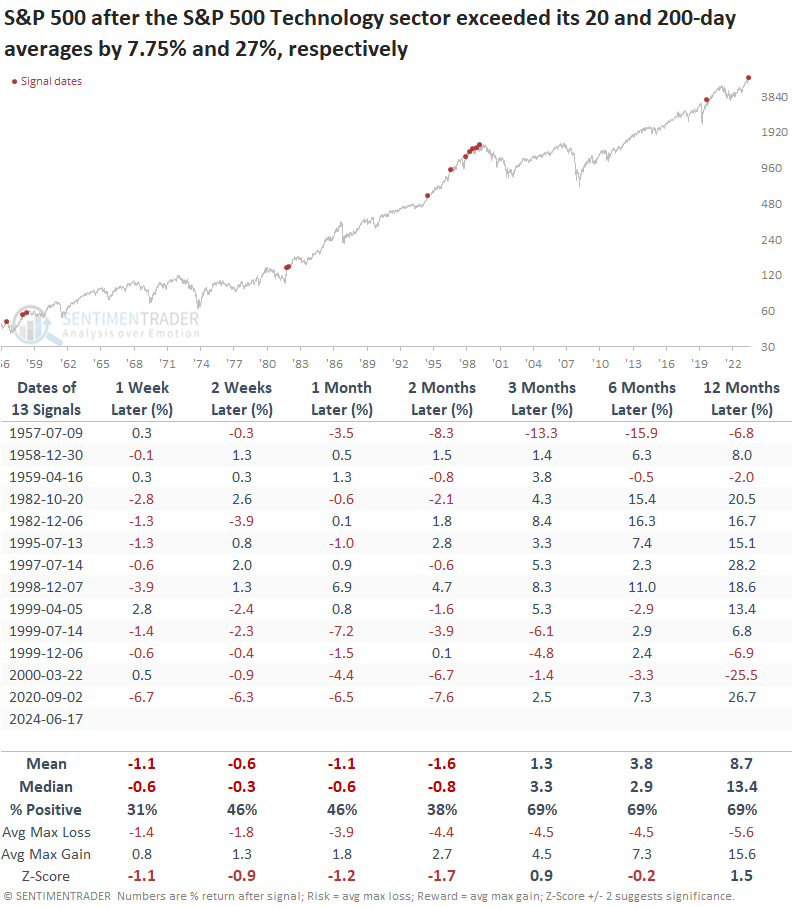
Applying these signals to the S&P 500 indicates that the worlds most benchmarked index future might parallel the Technology sector's potential short-term difficulties. With the Technology sector currently holding a significant portion of the S&P 500's weighting, a deceleration in this sector would likely exert downward pressure on the broader market.
Semiconductor perspective
On June 14, 2024, the S&P 1500 Semiconductor sub-industry group, a cap-weighted index significantly influenced by Nvidia, Broadcom, and others, closed 60% above its 200-day moving average. This rare overbought scenario has only been seen two other times in the past 60 years, specifically in February 2000 and July 1995.
In 2000, the semiconductor index continued its rise for another month, reaching its peak in March 2000, which coincided with the peak in the S&P 500. During this period, the index eventually surged 77% above its 200-day average.
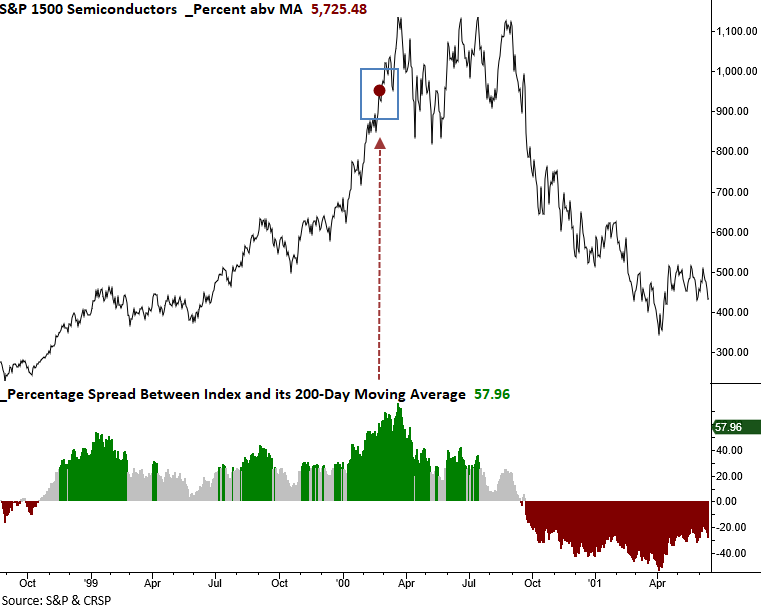
When the S&P 1500 Semiconductor sub-industry group surged 60% above its 200-day average in July 1995, the Index promptly entered a consolidation phase. Although it eventually reached a new high in September 1995, that peak stood unchallenged for more than a year.
What the research tells us...
The Technology sector closed above its 20 and 200-day moving averages by one of the most significant amounts in history. Similar overbought conditions suggest the group could struggle over the subsequent month, all within a bullish long-term uptrend. Should we sell all our technology stocks? Absolutely not! However, given the circumstances, I would not add any new exposure for now. Furthermore, if your portfolio has an overweight position in Technology relative to the benchmark, it would be wise to trim some exposure to manage risk effectively. Semiconductors, one of the key industries within Technology, has risen above its 200-day moving average by over 60%, suggesting an extreme overbought condition. Is this time different?