
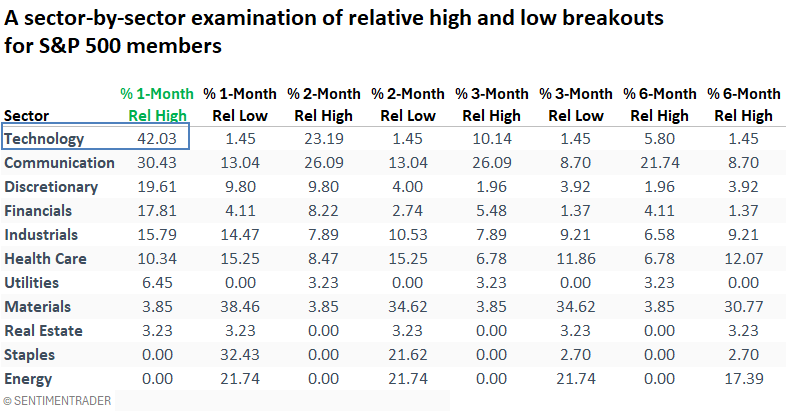
Technology dominates the relative highs breakout list

Key points:
- Most stocks hitting relative highs are concentrated in cyclical sectors
- Over 42% of technology sector stocks registered a 1-month relative high, leading all sectors
It's all relative when stock indexes advance
One of my favorite quotes captures why I focus so heavily on relative strength: In a bull market, almost everything advances, but to beat the market, you have to own what's rising more than the market.
"Markets are risky. And risk, everyone knows, involves loss, or the possibility of loss. The connection we all make between risk and loss is intuitive and powerful. Because the probability of equity loss is greatest when markets are falling, a stock's ability to defend against loss is most critically tested, and therefore best measured, during periods of general market decline. But rising markets are risky, too. Regardless of how well a stock defends against loss during falling markets, if it does not score gains as the market rises, the trader is subjected to another risk, lost opportunity. Because the probability of opportunity loss is greatest when the broad list advances, a stock's offensive qualities are best measured when the market rises." Unknown
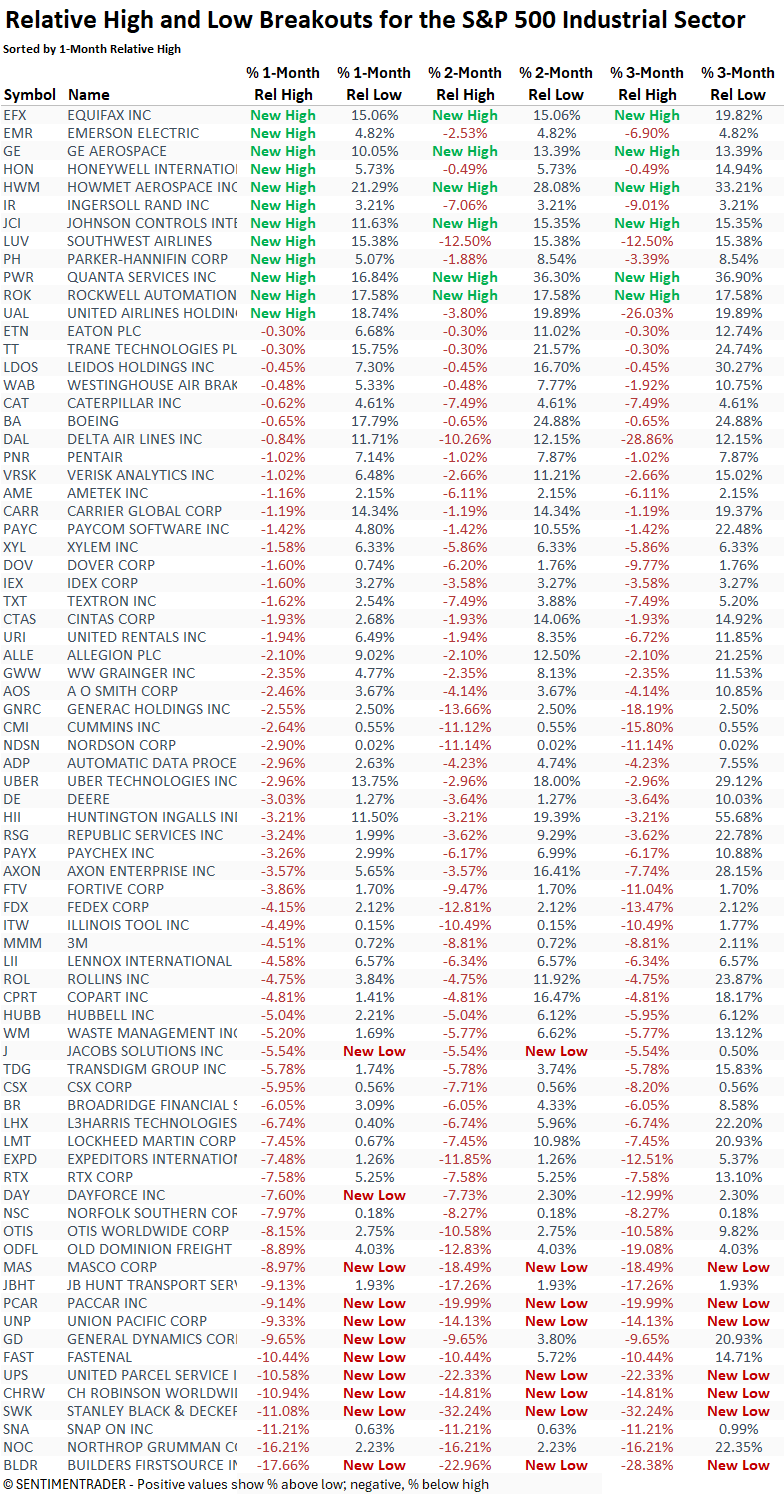
With that in mind, the table below highlights a clear trend in relative highs, pointing to offensive sectors like technology, which led all groups in relative breakouts on Wednesday.
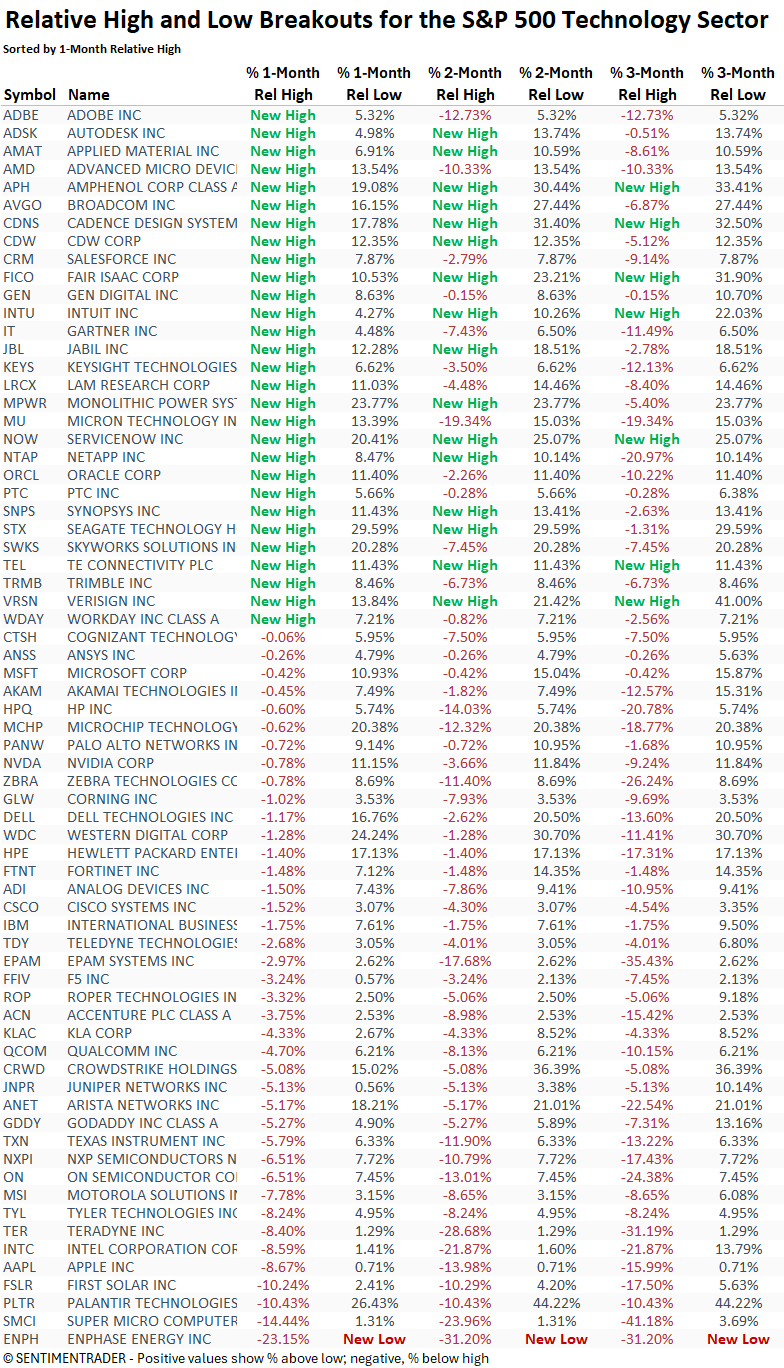
Software and semiconductor companies dominated the technology stocks list, registering a 1-month relative high compared to the S&P 500.
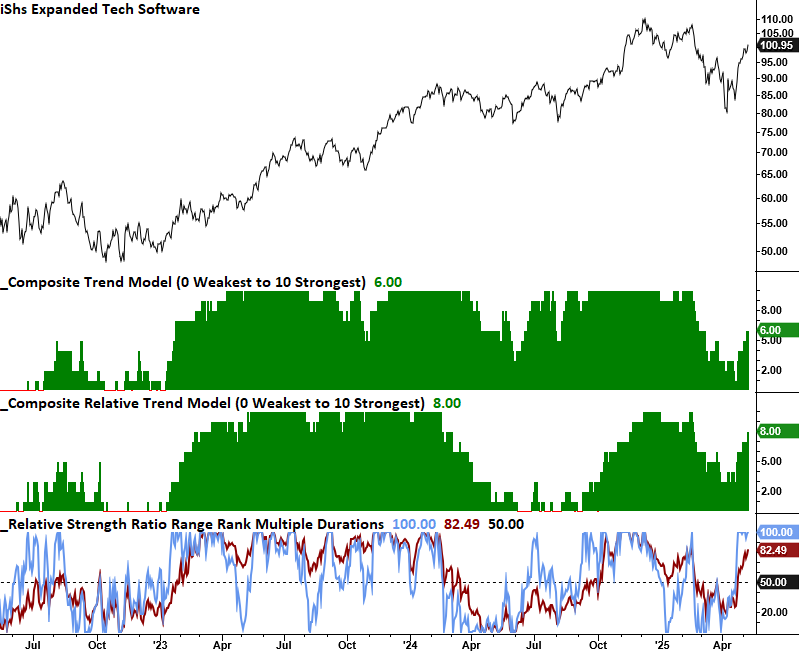
Investors may want to prioritize exposure to software stocks, as their trend and relative trend scores look more favorable.
According to our website's trend score tool, the Expanded Software ETF (IGV) holds a relative trend score of 7 against the S&P 500, while the Semiconductor ETF (SMH) lags with a score of just 1.
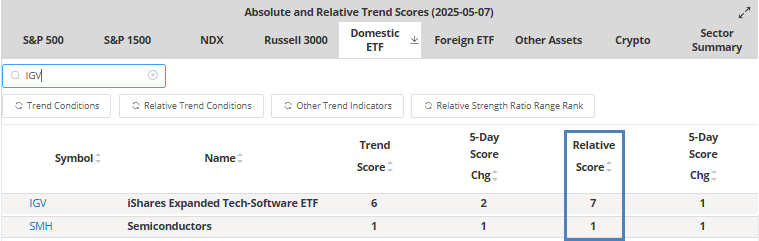
IGV maintains a relative trend score of 8 versus SMH, suggesting a favorable relative strength backdrop. Additionally, over the past month, software has recorded a relative high against semiconductors on five occasions.
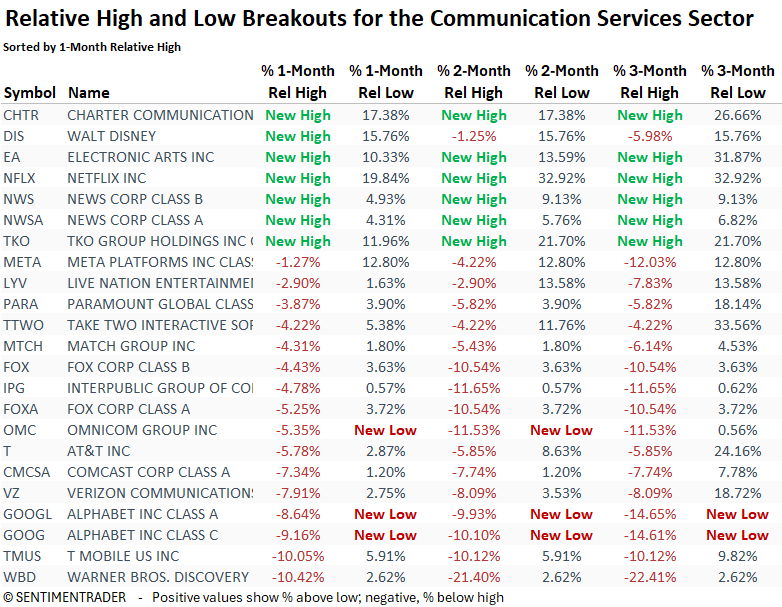
Over 30% of communication services stocks recorded a 1-month relative high, the second best of any group. Netflix continues to be my favorite name in this group.
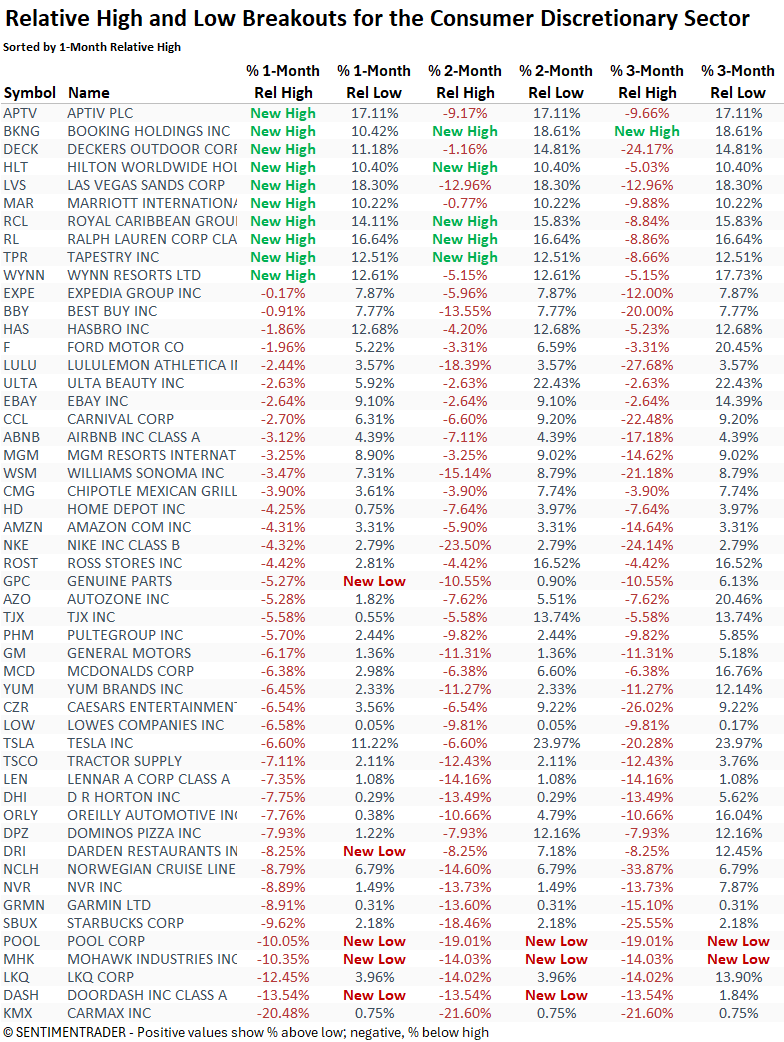
A clear pattern emerges when viewing the relative breakouts in the consumer discretionary sector. Experiences (hotels and cruise operators) over things (housing, cars, etc.). That said, Tapestry looks good.
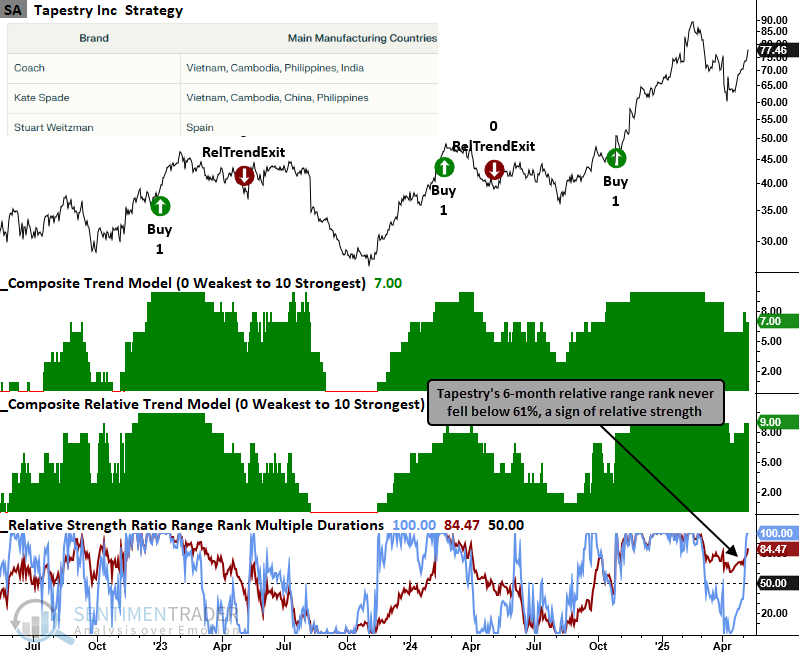
Tapestry registered a two-month high on Wednesday. Furthermore, its 6-month relative range rank (red line in chart) never fell below 61% during the correction, indicating a strong relative trend. With limited exposure to manufacturing in China, this one is worth watching.
Table courtesy of perplexity.ai.
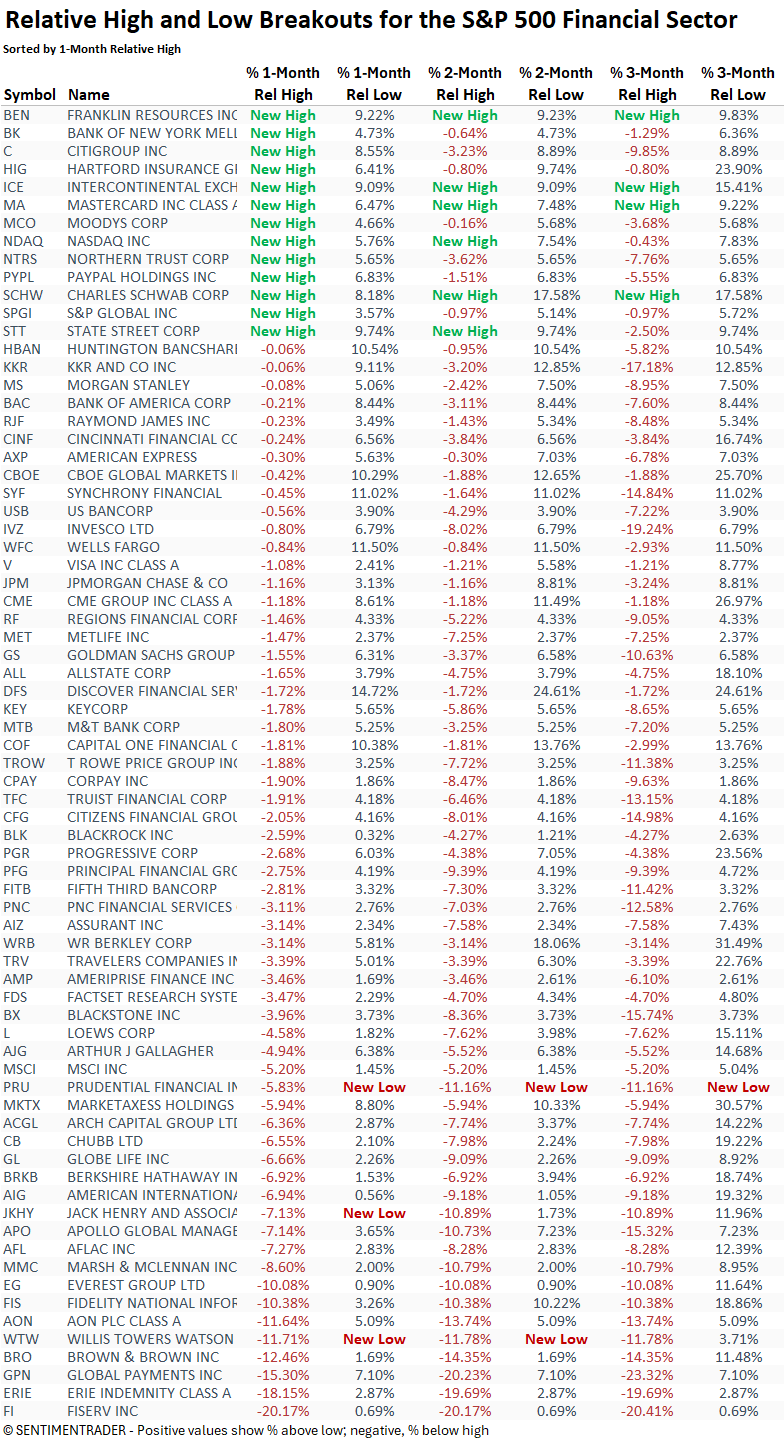
Mastercard continues to show strength in Financials, and although Charles Schwab has broken out on an absolute and relative basis, potentially due to its spot cryptocurrency trading announcement, I find Robinhood's (HOOD) setup more compelling.
GE Aerospace (GE) and Quanta Services (PWR) continue to stand out as leaders within the industrials sector. In contrast, Builders FirstSource (BLDR), which operates in residential and commercial construction, remains unattractive amid elevated mortgage rates and a sluggish housing market.
A beaten-down stock appears to be turning the corner
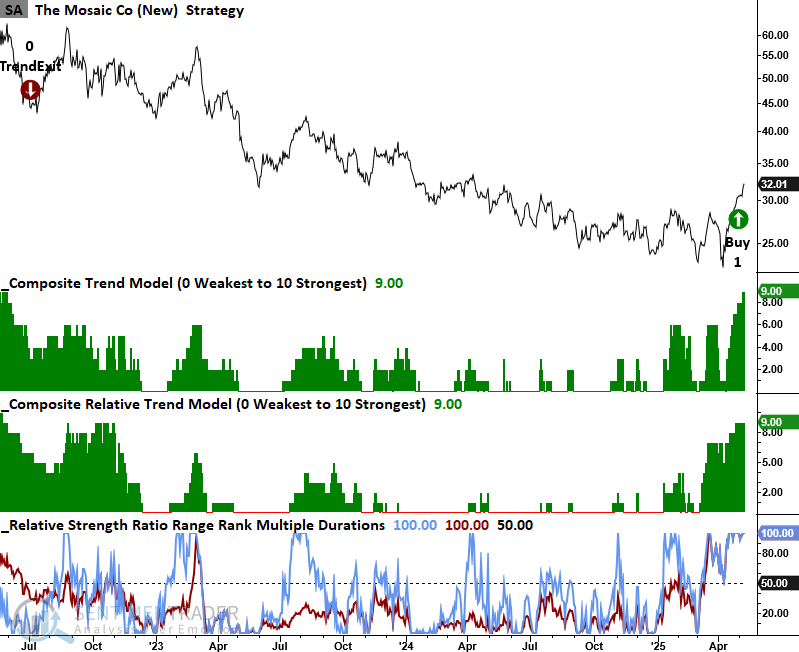
The only stock in the S&P 500 Materials sector to register a relative high on Wednesday was Mosaic, a fertilizer company that produces phosphate and potash. It recently triggered a trend score buy signal following an extended downtrend. Keep this one on your radar.
What the research tells us...
Cyclical sectors, particularly technology, dominate the relative high breakout list, signaling strong leadership and a healthy appetite for risk among investors. This development is an encouraging sign for the broader market, as sustained breakouts in economically sensitive groups often precede or accompany durable market advances. When cyclical sectors lead, it typically reflects optimism about growth and earnings prospects, reinforcing the momentum behind the rally.
Given the ongoing debate about a potential recession, should we trust Mr. Market's message or the talking heads?