Products
SentimenTrader Trading Tools
‍
Backtest Engine
My Trading Toolkit
Correlation Analysis
Seasonality
Market Prediction
Indicators & Data API
‍
Proprietary Indicators & Charts
Market Data API
Strategies & Scanner
‍
50+ Trading Strategies
Smart Stock Scanner
Smart Option Scanner
Research Reports
‍
Research Solutions
Reports Library
Free Resources
Simple Backtest Calculator
Simple Seasonality Calculator
The Kelly Criterion Calculator
Sentiment Geo Map
Public Research Reports
Education
Sentiment Indicators
Technical Indicators
Pricing
Company
About
In the News
Testimonials
Client Success Stories
Contact
Log inLoginSign up
< BACK TO ALL REPORTS

Tech, dollar suffer selling "shocks"

Jason Goepfert
2020-02-24
The Nasdaq Composite suffered a 2 standard deviation loss, soon after hitting an all-time high. The U.S. dollar suffered a shocking loss, too.

Tech’s shocking decline

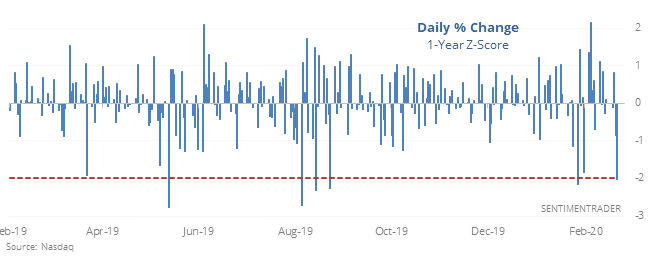
Friday’s loss was more than 2 standard deviations beyond the typical daily change in the Nasdaq over the past year, likely a shock to newer investors. Coming quickly on the heels of an all-time high, there is a temptation to believe it’s a sign the rally has ended.

That kind of thinking doesn’t have much support.

Nasdaq 1-day z-score

When we look at every time the Composite quickly cycled from an all-time high to a 2 standard deviation loss since 1970, 3 of them coincided with important peaks while the 18 others did not. If anything, this was a good sign for bulls especially in the S&P 500 which showed surprisingly robust returns.

There are many compelling reasons to believe that upside should be limited in the coming month(s), but using a reason like Friday's selling sounds better in theory than it has worked in practice.


The dollar's shocking decline, too

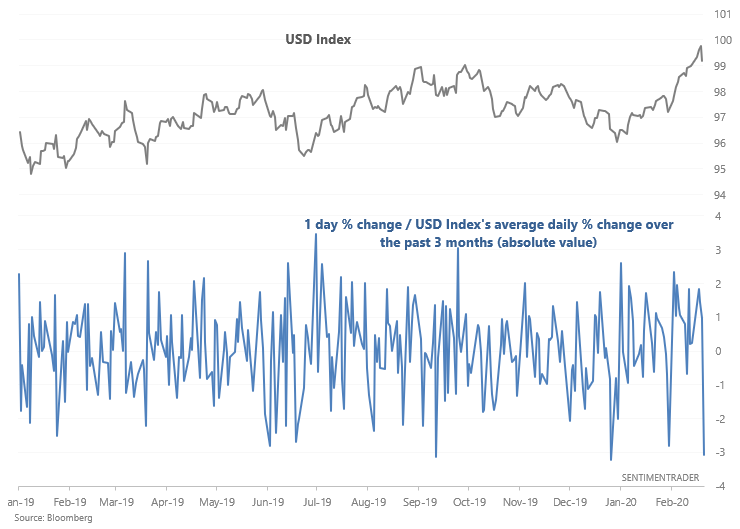
It wasn't just tech's decline that was shocking. The U.S. Dollar Index dropped sharply after a strong rally that pushed it to multi-year highs.

If we look at the USD Index's 1 day % change vs. a 3 month average of daily % changes, this was a rather abrupt reversal in the uptrend.

Dollar large decline

When the USD Index reached at least a 1 year high and then dropped like a stone (defined by the above chart < -3), the USD Index's returns over the next week were bearish. 

Dollar after big decline

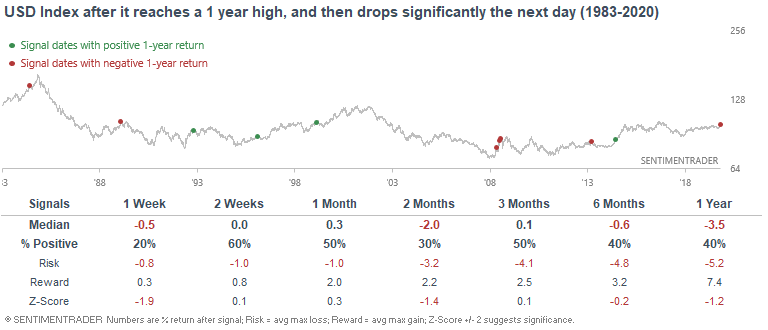
Most sudden reversals in the USD's uptrend led to more downside over the coming weeks. Recent signs of upside momentum in the buck have had much more positive returns over the following month(s) so it's debatable whether Friday's single loss will be enough yet to reverse those positive signs.

This is an abridged version of our recent reports and notes. For immediate access with no obligation, sign up for a 30-day free trial now.

We also looked at:

  • Professional money managers are positive on the U.S. and taking above-average risk
  • With put/call volume ratios low, open interest ratios are high
  • More technical warning signs have triggered
  • Gold's weekly Relative Strength Index is very high
PRODUCTS
SentimenTrader
Trading Tools
Indicators & Data API
‍
Strategies & Scanner
‍
Research Reports
FREE
RESOUrCES
Simple Backtest
Calculator
Simple Seasonality
Calculator
The Kelly Criterion
Calculator
Sentiment Geo Map
‍
Public Research Reports
‍
Education
Sentiment Indicators
‍
Technical Indicators
‍
Pricing
Bundle pricing
‍
FAQ
‍
Announcements
‍
COMPANY
‍
About
‍
In the News
‍
Testimonials
‍
Client Success Stories
CONTACT
‍
General Inquiries
‍
Media Inquiries
‍
Financial Professionals Inquiries
‍
© 2026 Sundial Capital Research Inc. All rights reserved.
Setsail Marketing
TermsPrivacyAffiliate Program
Risk Disclosure: The information and tools provided are for research and analytical purposes only and are not intended as investment advice. Market analysis involves uncertainty, and outcomes may differ from expectations. Users should conduct their own due diligence and consider their individual circumstances before making any financial decisions. Past performance is not necessarily indicative of future results.

Hypothetical Performance Disclosure: Hypothetical performance results have many inherent limitations, some of which are described below. No representation is being made that any account will or is likely to achieve profits or losses similar to those shown; in fact, there are frequently sharp differences between hypothetical performance results and the actual results subsequently achieved by any particular trading program. One of the limitations of hypothetical performance results is that they are generally prepared with the benefit of hindsight. In addition, hypothetical trading does not involve financial risk, and no hypothetical trading record can completely account for the impact of financial risk of actual trading. for example, the ability to withstand losses or to adhere to a particular trading program in spite of trading losses are material points which can also adversely affect actual trading results. There are numerous other factors related to the markets in general or to the implementation of any specific trading program which cannot be fully accounted for in the preparation of hypothetical performance results and all which can adversely affect trading results.

Testimonial Disclosure: Testimonials appearing on this website may not be representative of other clients or customers and is not a guarantee of future performance or success.