Products
SentimenTrader Trading Tools
‍
Backtest Engine
My Trading Toolkit
Correlation Analysis
Seasonality
Market Prediction
Indicators & Data API
‍
Proprietary Indicators & Charts
Market Data API
Strategies & Scanner
‍
50+ Trading Strategies
Smart Stock Scanner
Smart Option Scanner
Research Reports
‍
Research Solutions
Reports Library
Free Resources
Simple Backtest Calculator
Simple Seasonality Calculator
The Kelly Criterion Calculator
Sentiment Geo Map
Public Research Reports
Education
Sentiment Indicators
Technical Indicators
Pricing
Company
About
In the News
Testimonials
Client Success Stories
Contact
Log inLoginSign up
< BACK TO ALL REPORTS

Taking another stab at extremes in Biotech

Jason Goepfert
2022-02-17
The Biotechnology sector has suffered some of the worst selling pressure out of all sectors and industries over the past few months. In January, breadth in the sector hit some of the worst levels in 23 years. It has since recovered, suggesting the worst is behind us.

Key points:

  • Selling in Biotech stocks reached a historic extreme in late January
  • Since then, the stocks have tried to recover, and a composite breadth indicator has been rebounding
  • Similar reversals preceded excellent returns, but there was a failure in December

In Biotech, extreme got even more extreme

In December, we looked at the near-washout in Biotechnology stocks. As we saw with the high level of stocks in the Nasdaq cut in half, many of those were in Health Care, specifically Biotechnology.

It turns out it wasn't quite the washout. Sellers returned in force and pushed the stocks to lower lows. That false bottom in December triggered several new extremes now attempting a reversal.

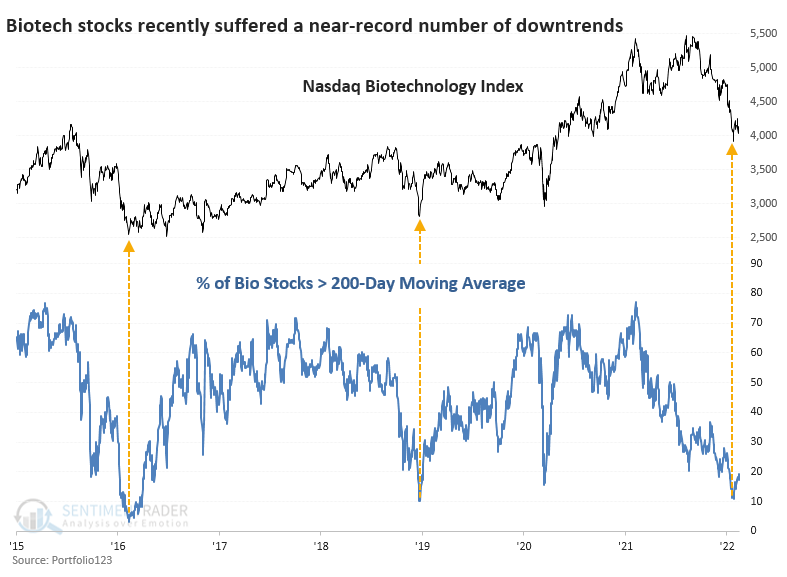
Touching on some of the longer-term metrics we looked at in December, fewer than 10% of the stocks managed to hold above their 200-day moving averages at the worst point last month. Only the cascading declines in 2016 and 2018 matched this in recent years.

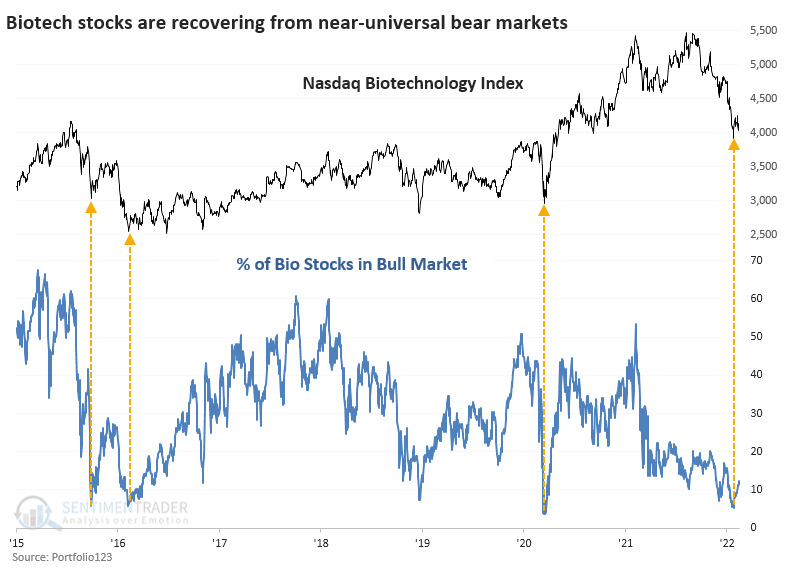
That selling pressure pushed more than 95% of the stocks into bear markets - more than 20% off their peaks. Again, that level of wholesale and heavy pressure has been matched only a few times in recent years.

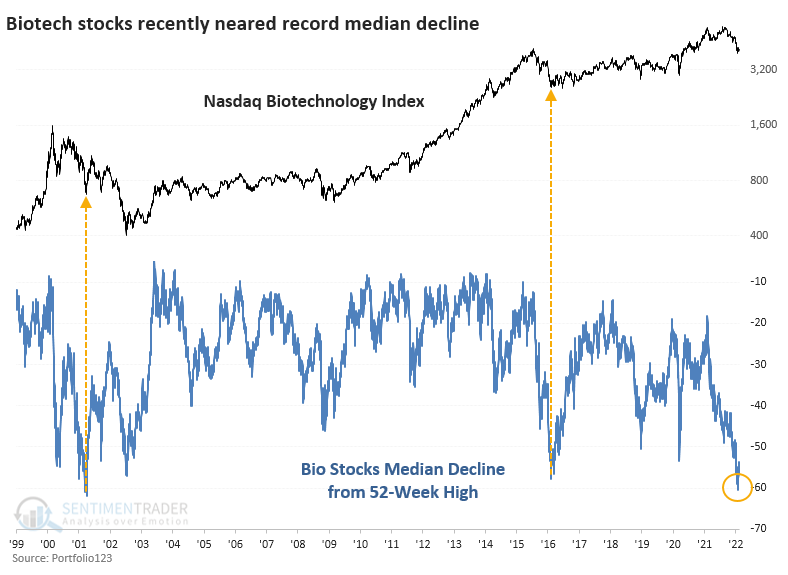
Even more notably, the median decline these stocks suffered was so massive that we need to go back to at least 1999 to see similar behavior. Near the end of January, the average Biotech stock had lost more than 60% of its value from its 52-week high. The only dates that exceeded this were a couple in late March and early April 2001. It got close in February 2016 when the median drawdown reached -57%.

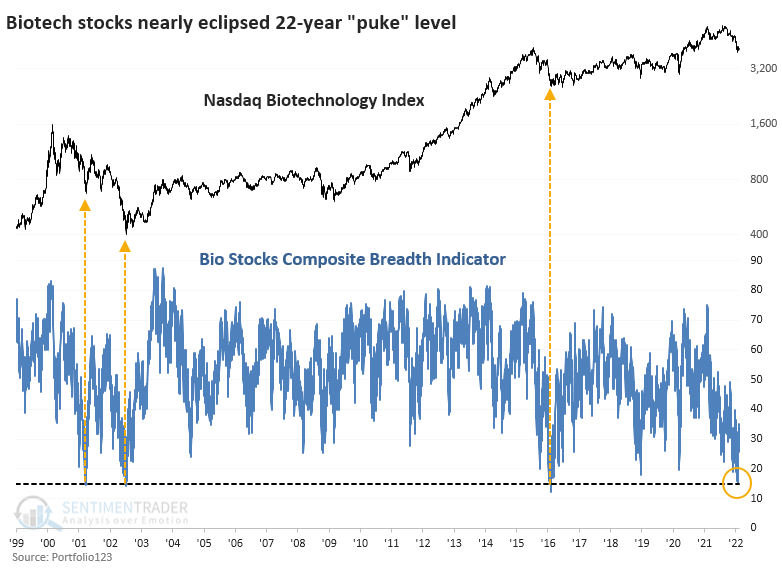
Aggregate breadth reached a historic extreme and is trying to recover

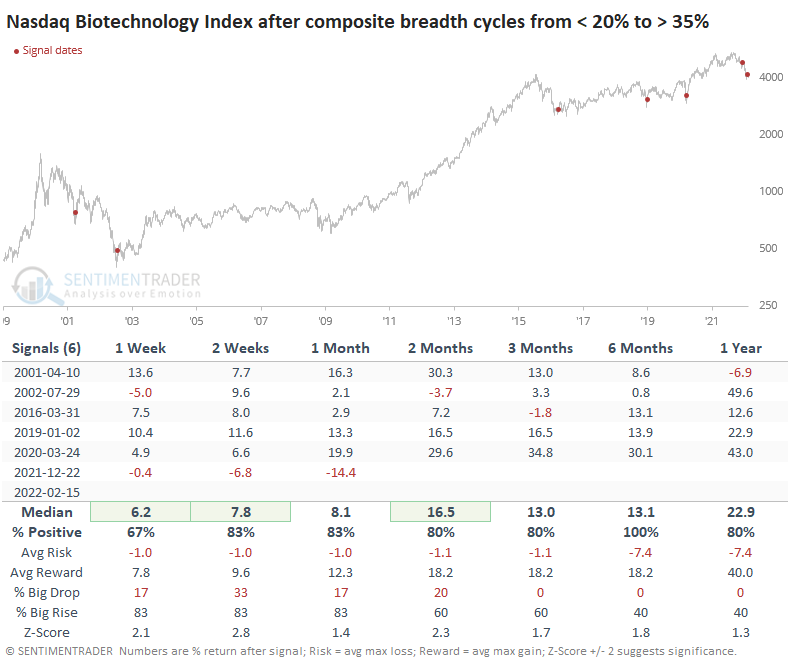
The chart below shows the overall breadth composite we looked at in December. It dropped below 15% in late January, which matches the lowest readings in 23 years, on par with March 2001, July 2002, and February 2016.

The table below shows every time the composite fell below 20% and then recovered above 35%, which it just did. Returns in the months ahead were excellent, though that terrible December failure shows up.

What the research tells us...

There was a reasonable basis to expect long-term returns to be positive for Biotechnology in mid-December. This was one of those times when extreme got even more extreme, and anyone who was early is sitting on significant losses. Now there has been another round of extremes, even more profound than a couple of months ago, and on par with the very worst panics in 23 years. There has been something of a recovery, and other than December's folly, returns after similar behavior were excellent over the medium- to long-term.

PRODUCTS
SentimenTrader
Trading Tools
Indicators & Data API
‍
Strategies & Scanner
‍
Research Reports
FREE
RESOUrCES
Simple Backtest
Calculator
Simple Seasonality
Calculator
The Kelly Criterion
Calculator
Sentiment Geo Map
‍
Public Research Reports
‍
Education
Sentiment Indicators
‍
Technical Indicators
‍
Pricing
Bundle pricing
‍
FAQ
‍
Announcements
‍
COMPANY
‍
About
‍
In the News
‍
Testimonials
‍
Client Success Stories
CONTACT
‍
General Inquiries
‍
Media Inquiries
‍
Financial Professionals Inquiries
‍
© 2026 Sundial Capital Research Inc. All rights reserved.
Setsail Marketing
TermsPrivacyAffiliate Program
Risk Disclosure: The information and tools provided are for research and analytical purposes only and are not intended as investment advice. Market analysis involves uncertainty, and outcomes may differ from expectations. Users should conduct their own due diligence and consider their individual circumstances before making any financial decisions. Past performance is not necessarily indicative of future results.

Hypothetical Performance Disclosure: Hypothetical performance results have many inherent limitations, some of which are described below. No representation is being made that any account will or is likely to achieve profits or losses similar to those shown; in fact, there are frequently sharp differences between hypothetical performance results and the actual results subsequently achieved by any particular trading program. One of the limitations of hypothetical performance results is that they are generally prepared with the benefit of hindsight. In addition, hypothetical trading does not involve financial risk, and no hypothetical trading record can completely account for the impact of financial risk of actual trading. for example, the ability to withstand losses or to adhere to a particular trading program in spite of trading losses are material points which can also adversely affect actual trading results. There are numerous other factors related to the markets in general or to the implementation of any specific trading program which cannot be fully accounted for in the preparation of hypothetical performance results and all which can adversely affect trading results.

Testimonial Disclosure: Testimonials appearing on this website may not be representative of other clients or customers and is not a guarantee of future performance or success.