
Taking advantage of market holiday bias

Key points
- The stock market has shown a persistent long-term tendency to rally before and after market holidays
- The six days surrounding holidays gained 13% more than all other days combined despite representing only roughly 1/5th of all trading days
- Stocks' risk-adjusted return around holidays far outpaces all other sessions
Not all holidays are equal - but they are for this test
Much analysis has been done regarding stock market performance around market holidays. Often, that analysis attempts to find the best days before and after a given holiday.
While I am not above seeking optimum parameters, there is admittedly a bit of cherry-picking in that type of analysis. So, for this test, rather than wondering if, say, the day before July 4th has performed better than the day after Christmas, we will treat all holiday days the same.
- This test analyzes the performance of the S&P 500 Index solely on the three trading days before and after each market holiday
We will refer to these days as "Holiday Days." The holidays included are:
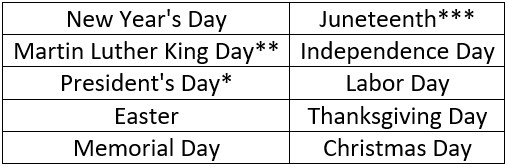
*- Before 1971, President's Day entailed two separate market holidays - Washington's Birthday and Lincoln's Birthday
** - Martin Luther King Day became a holiday in 1986
*** - Juneteenth became a holiday in 2022
There is typically an overlap between the three days after Christmas and the three days before New Year's. Holiday Days account for roughly 19% of all trading days or approximately 1 out of every 5.
Buying three days before and selling three days after
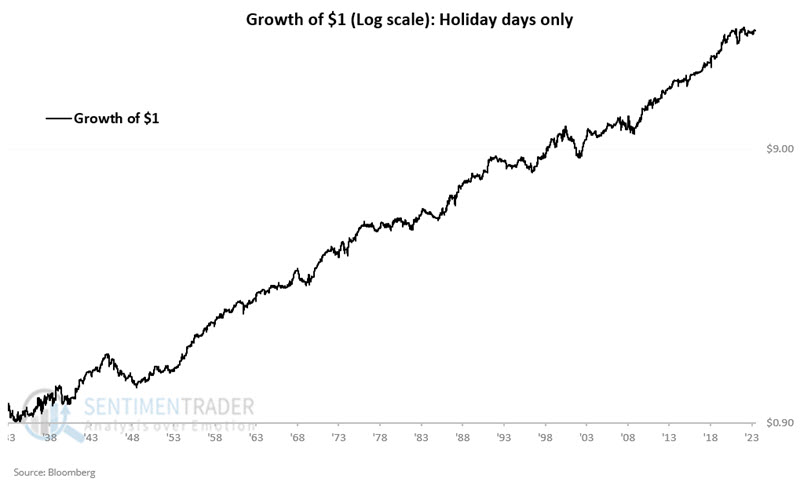
The strategy followed below is simple: Buy and hold the S&P 500 Index only during the three trading days before and the three trading days after every market holiday starting in December 1933. The chart below shows the hypothetical growth of $1 using the holiday strategy.

The critical thing to note is the long-term tendency for the equity curve to rise from lower left to upper right. But let's try to put these results into some perspective. The chart below shows the same results as above in a slightly different format - a logarithmic scale. Once again, the key thing to note is the generally consistent nature of Holiday Days' performance.
The chart below is quite enlightening. It displays the growth of $1 for the S&P 500 Index held only during Holiday Days (black line) compared to the growth of $1 in the S&P 500 Index during all other trading days (blue line).
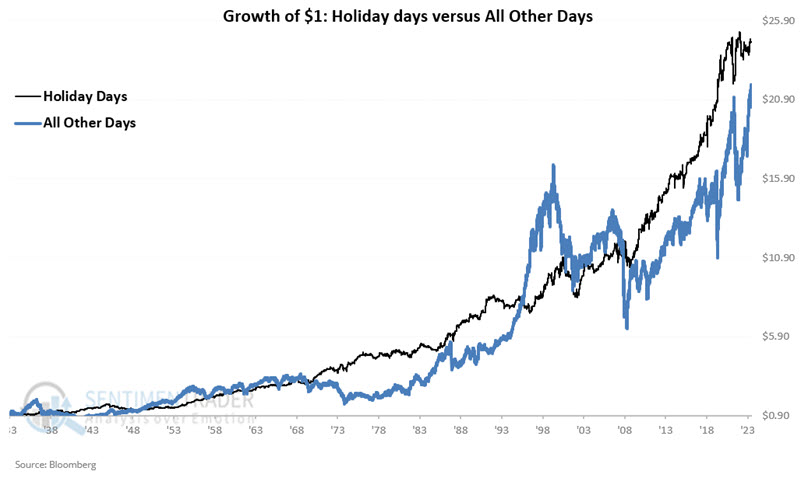
Despite representing only 19% of all trading days, Holiday Days gained +2,354% versus All Other Days (representing 81% of all trading days), which earned only +2,083%. The bottom line: Holiday Days have delivered more total return in just a fifth of the time.
A look at the daily numbers
The table below summarizes daily performance results for Holiday Days separate from performance results for all other trading days.
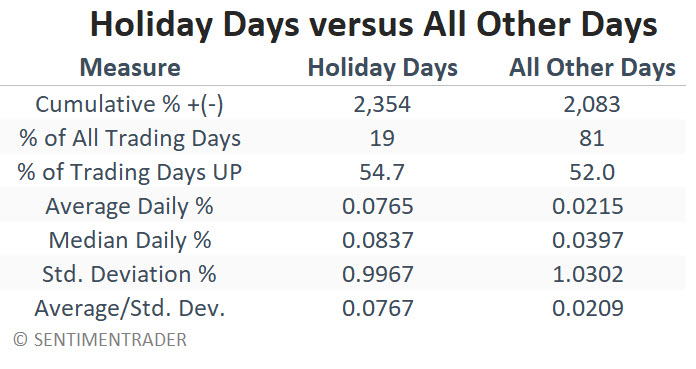
Key things to note - Holiday Days had:
- A higher % of UP days (54.7% versus 52.0%)
- A significantly higher average and median daily return
- A slightly lower standard deviation of daily returns
- A 3.67-to-1 edge in risk-adjusted return (average daily % divided by standard deviation)
The table below summarizes the performance of the S&P 500 Index during all Holiday Day periods.
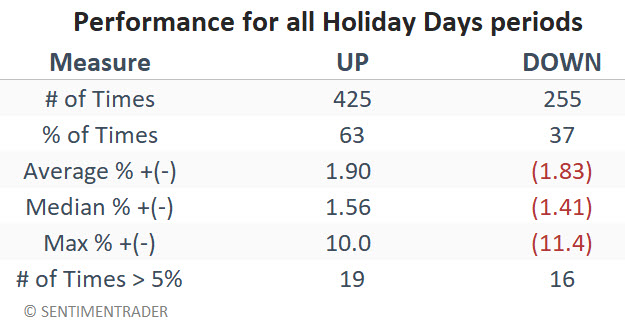
Roughly three of every five Holiday Day periods showed a gain, and the average and median gains are greater than the average and median loss.
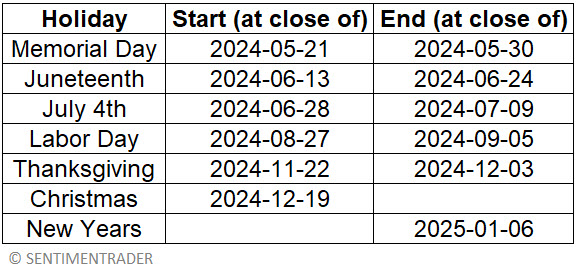
The next period - around Memorial Day - begins at the close on May 21st and extends through the close on May 30th.
The table below displays the Holiday Dates for the remainder of 2024.
What the research tells us…
One can argue that there is a general euphoria around market holidays (hey, who doesn't like a day off?). Historical results suggest that that good feeling somehow rubs off on the stock market. This information may be helpful to two distinct types of market participants. First, short-term traders might look for opportunities to trade the long side of the stock market via an index fund such as SPY around holidays to take advantage of the long-term upward bias. Second, investors holding cash they wish to put to work in the market may jump in around the holidays, hoping to get off to a positive start.