

Key points:
- A Composite Washout Model signal triggered on 2022-10-13
- The Long-Term Trend and Composite Recession models remain negative
- The overall Tactical Composite Trend Model (TCTM) maintains a cautious bull outlook
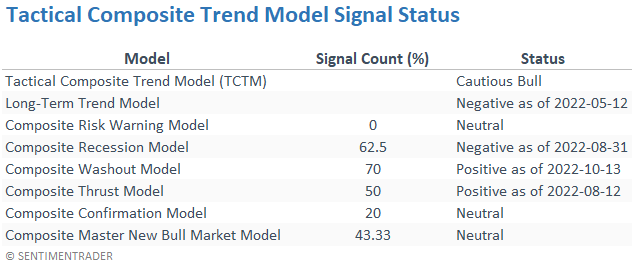
Tactical Composite Trend Model - Cautious Bull
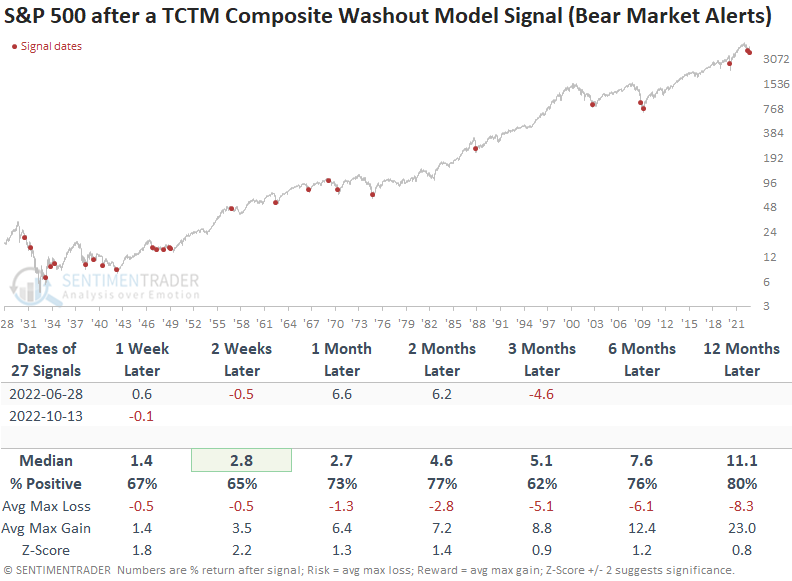
The environment for stocks remains challenging, with the S&P 500 in a long-term downtrend and the weight of the evidence suggesting a potential recession. The TCTM Composite Washout Model triggered its second oversold alert in the bear market after a multi-month decline to a new cycle low. The previous signal from June led to a substantial counter-trend rally.
The new Composite Washout signal does not alter the overall TCTM outlook, which remains with a cautious bull status after a Composite Thrust Model signal in August. With the thrust model signal window set to expire in mid-November, the overall TCTM model will return to a bearish status as the Long-Term Trend Model remains negative.
I use the washout model in bear markets to rent a position for a counter-trend trade. Cash is still king.
To see any published research about this model, click here.
Composite Washout Model - Positive
The Composite Washout Model issued a new alert on 2022-10-13 when price momentum for the S&P 500 turned favorable. So far, the S&P 500 is up slightly more than 2% since the signal date.
Please click here to see the CWM signal note.
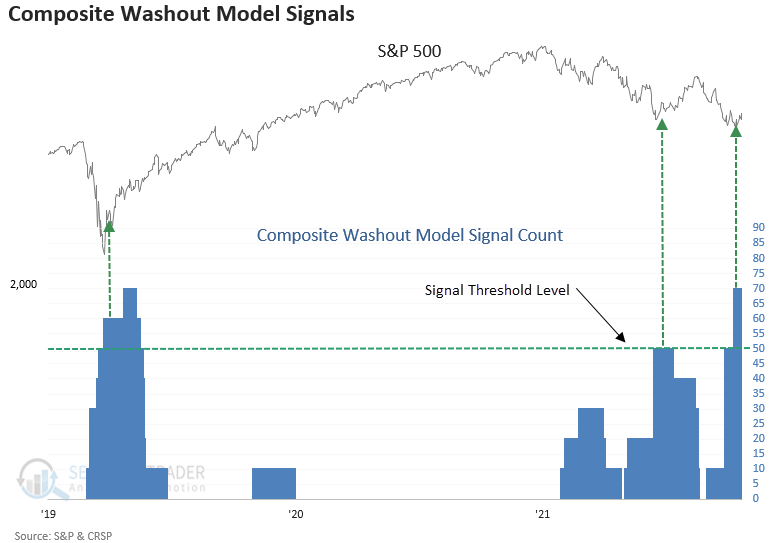
As with the previous signal, sometimes it takes a little more bottoming action before the market catches a more substantial bid.
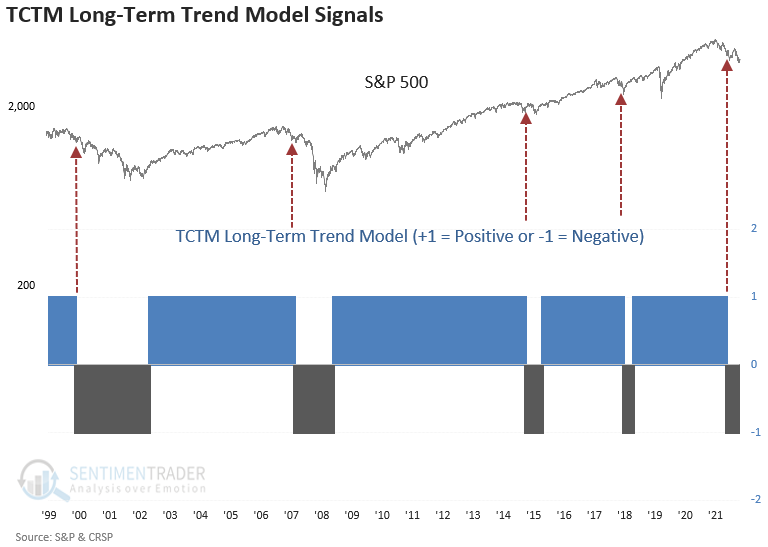
Long-Term Trend Model - Negative
With the S&P 500 substantially below the declining 200-day moving average, a potential reversal in the trend model looks highly unlikely in the foreseeable future.
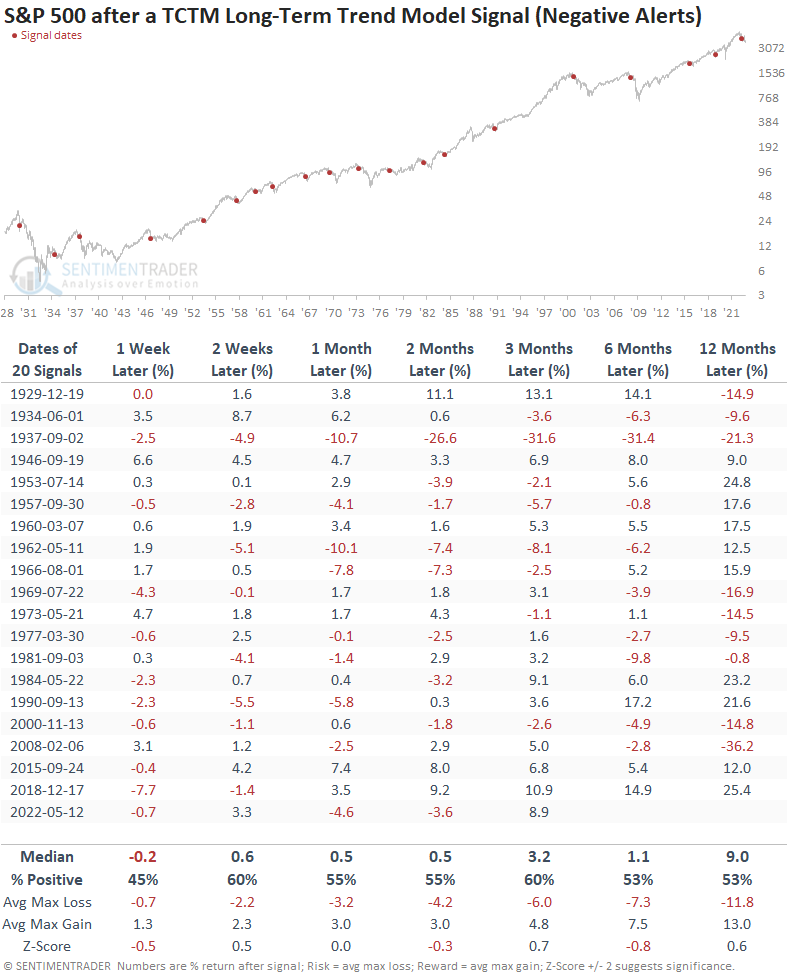
Since the Long-Term Trend Model turned negative in May, the S&P 500 is down 4.5% through last Friday. The six-month window is an important milestone. A negative return would not bode well for the market on a go-forward basis, as most instances continued to show a loss in the 12-month.
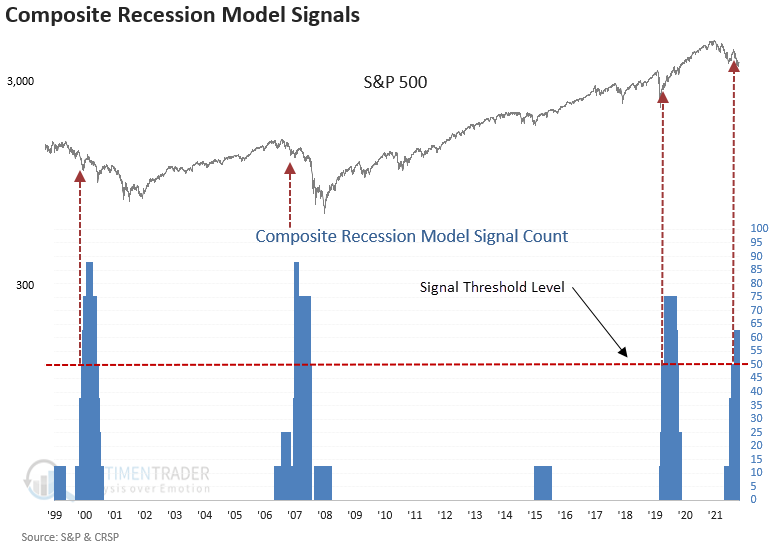
Composite Recession Model - Negative
The Composite Recession Model triggered the 16th alert since 1929 at the end of August. Bear markets associated with recessions typically experience more significant drawdown phases.
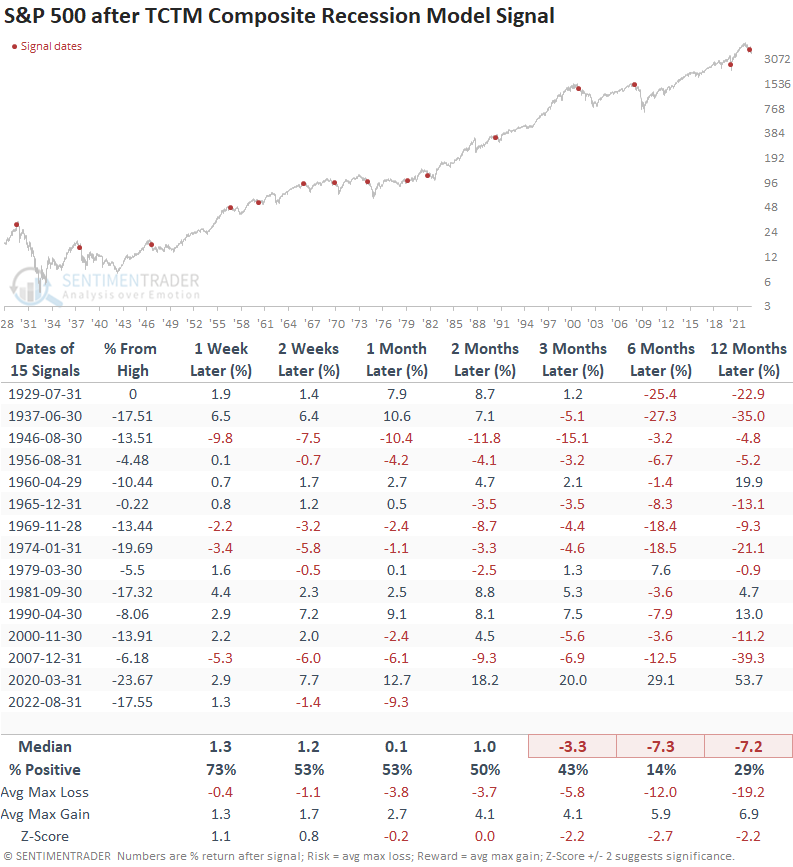
Composite Recession Model alerts are typically not a timely risk-off indicator. I use the model to identify the difference between a growth-scare correction and a recession. Bear markets accompanied by economic contractions tend to show significantly larger drawdowns.
The 6 to 12-month time frames suggest one should be mindful that the big-picture environment for stocks could be unfriendly through the first half of 2023.
Composite Thrust Model - Positive
The Composite Thrust Model triggered a new alert in August. Breadth thrust signals maintain an excellent long-term track record, which is why it's the only TCTM component other than the Long-Term Trend Model with a bullish vote in the TCTM outlook.
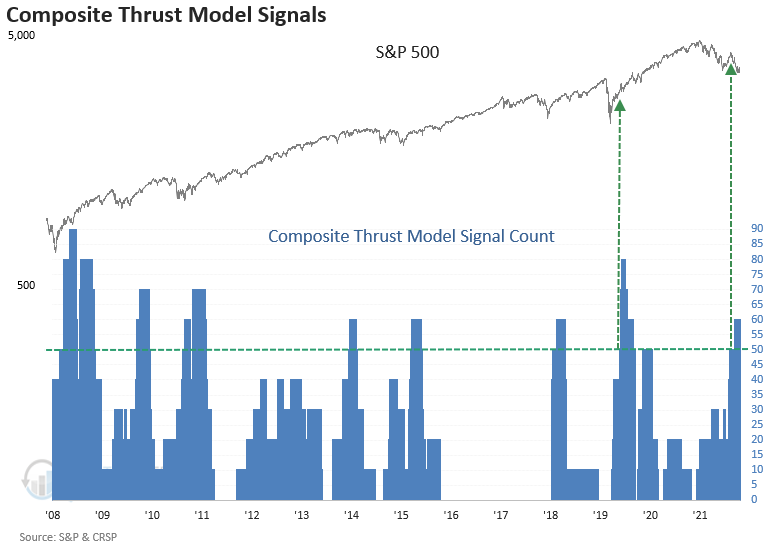
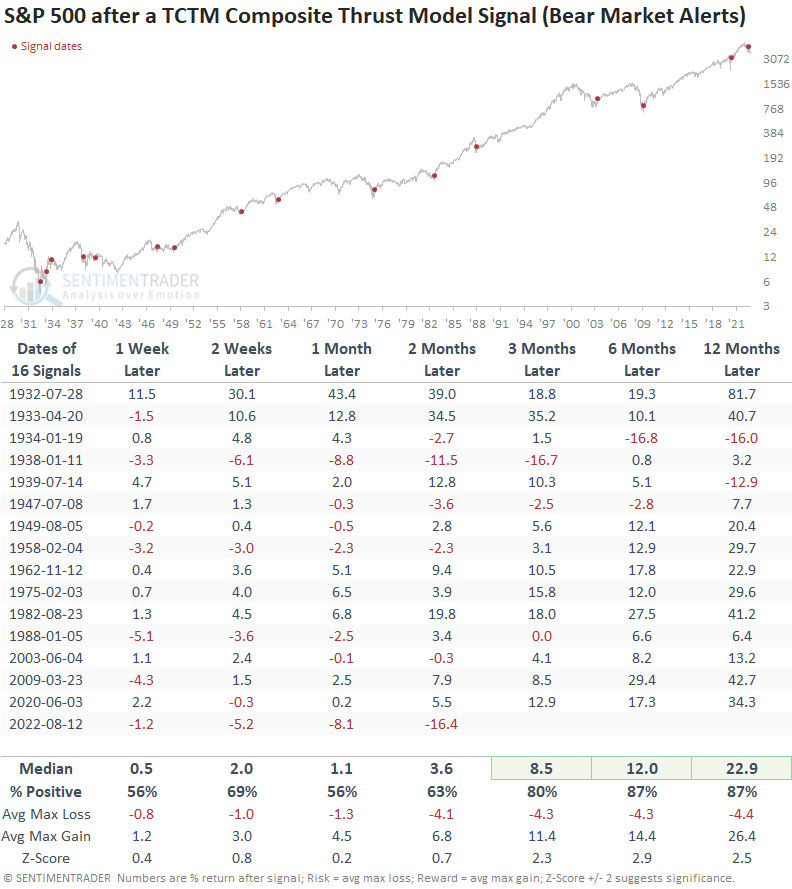
At the two-month mark, the current Composite Thrust Model signal shows the worst performance in history for alerts that occurred in a bear market. The second worst signal occurred in 1938 and continued on a negative path after two months but recovered in the 6 to 12-month windows.
Remember, no signal is infallible. Risk management is critical to any trading or investing strategy.
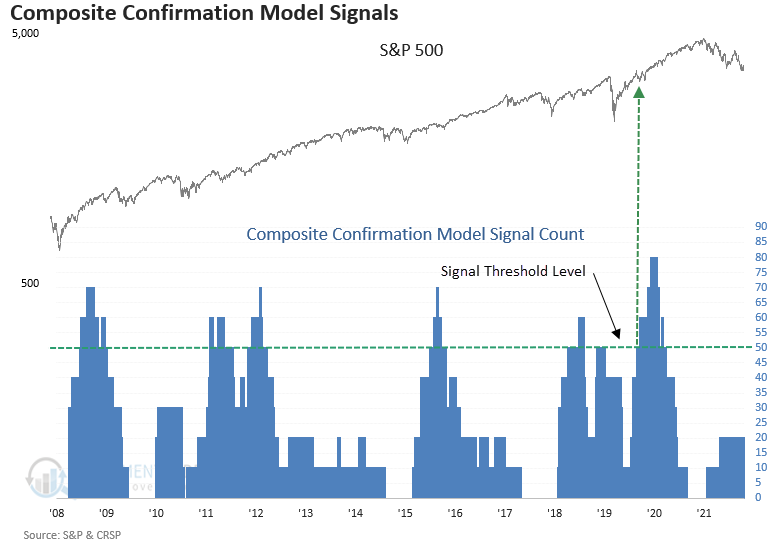
Composite Confirmation Model - Neutral
The Composite Confirmation Model signal count typically lags during the initial stages of a new bull market as the model contains big-picture components. Because the confirmation model uses less timely indicators, it's not as susceptible to whipsaw signals.
What the research tells us...
With a new Composite Washout Model alert, the S&P 500 looks poised for another counter-trend rally in an overall unfavorable environment. As always, duration and magnitude are unknown variables. As we approach mid-November, the TCTM status will most likely shift from cautious bull to negative as the thrust model signal window expires and the long-term trend model remains negative.
About the TCTM
The Tactical Composite Trend Model (TCTM), created by Dean Christians, represents decades of professional trading and financial market research. The TCTM aims to provide traders and investors with key signals around identifiable market turning points.