Key points:
- The TCTM long-term trend model turned negative on 5/12/22
- With the trend change, the TCTM status moved from cautious bull to negative
- The washout model count increased to 50% with 3 new signals since 6/14/22
- A recession composite model component triggered a signal on 4/29/22
Data as of 6/22/22.
| MODEL | Signal Count % | STATUS |
| Tactical Composite Trend Model (TCTM) | Negative | |
| Long-Term Trend Model | Negative as of 5/12/22 | |
| Composite Risk Warning Model | 0 | Neutral |
| Composite Recession Model | 12.5 | Neutral |
| Composite Washout Model | 50 | Neutral |
| Composite Thrust Model | 20 | Neutral |
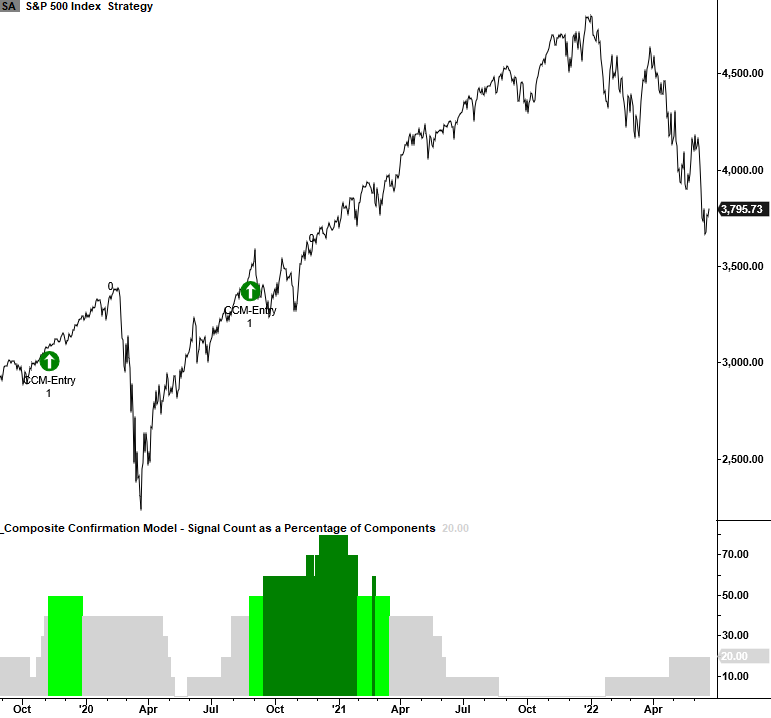
| Composite Confirmation Model | 20 | Neutral |
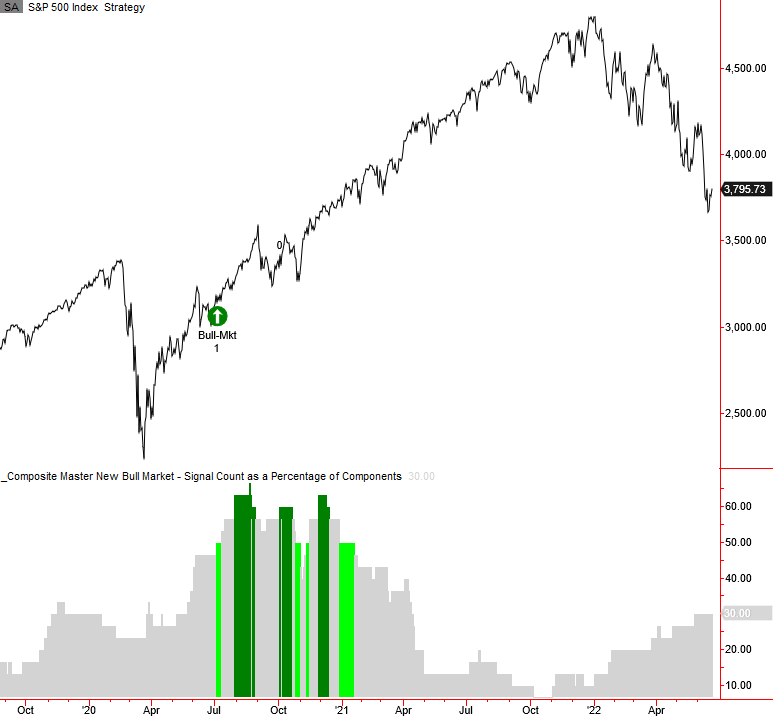
| Composite Master New Bull Market Model | 30 | Neutral |
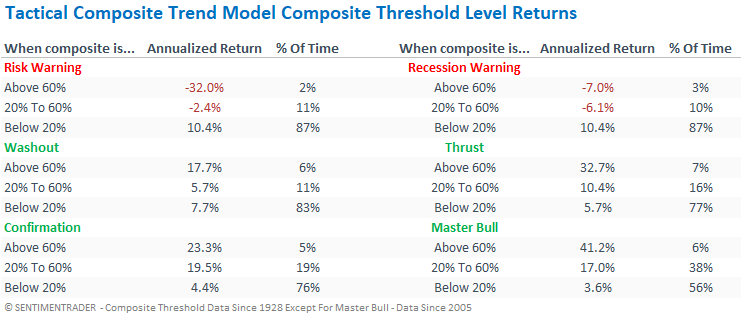
Tactical Composite Trend Model - Bearish
The TCTM long-term trend model flipped from bullish to bearish on 5/12/22. The trend change moves the overall TCTM status from cautious bull to negative. It's now imperative to monitor the recession composite model, which recently triggered a new alert. Remember, recessionary bear markets typically see more significant drawdowns.
The TCTM is not a pure black-box model that says we should be all in or out. And it should act as a complementary tool to your research process.
To see any published research about this model, click here.
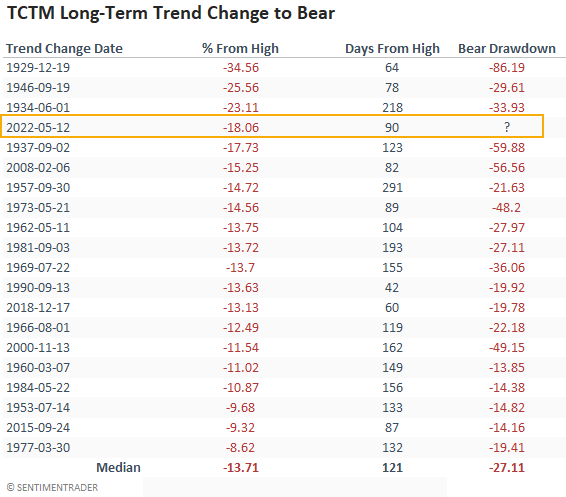
1. Long-Term Trend Model - Bearish
The long-term trend model turned bearish on 5/12/22. Annualized returns are unfavorable when the model is negative.
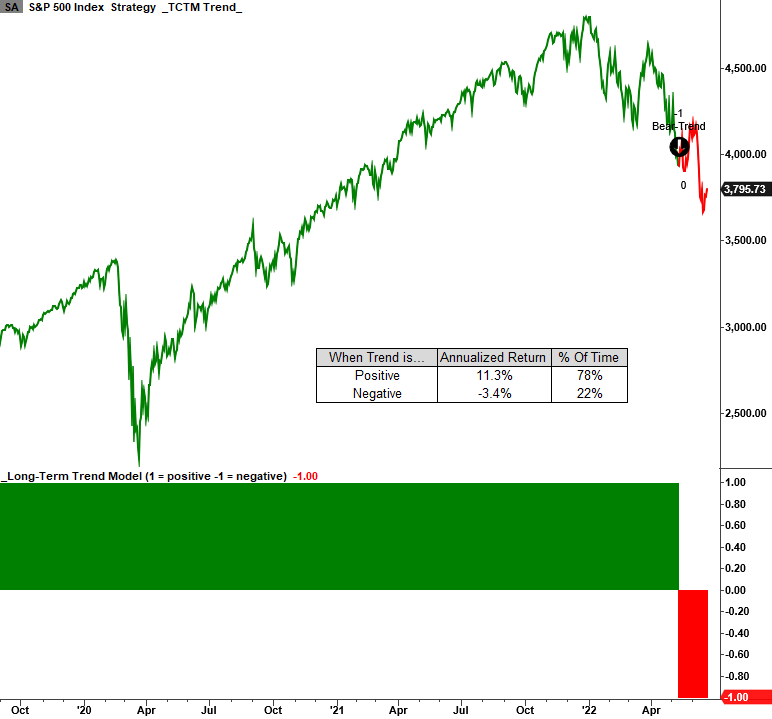
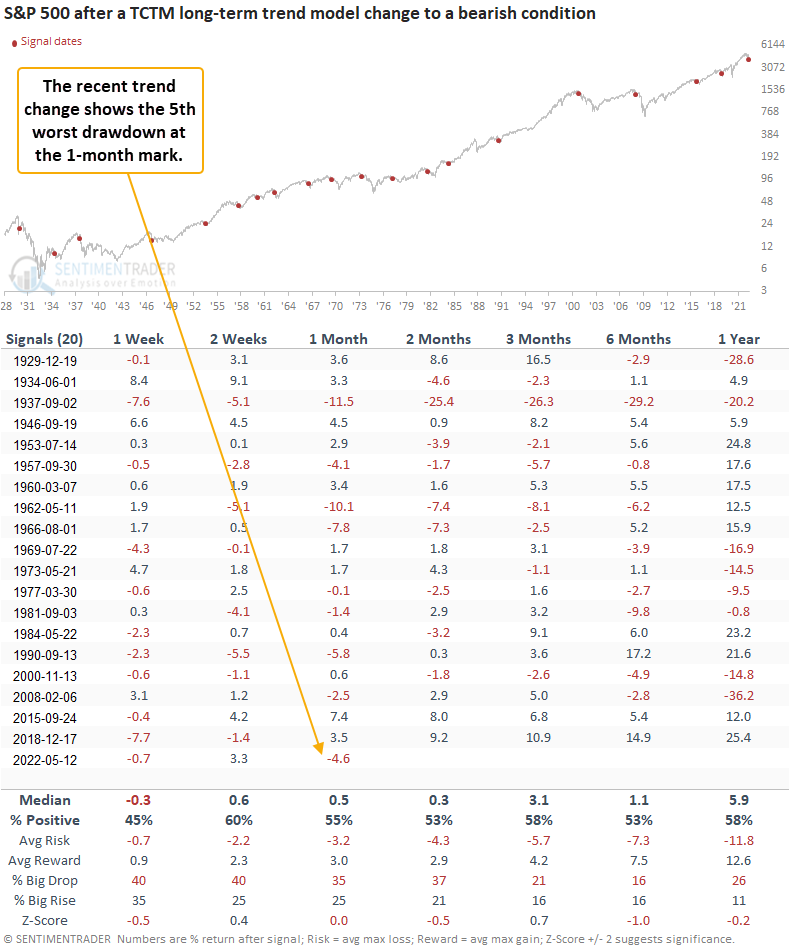
The long-term trend model change occurred when the S&P 500 was down 18.06% from the index peak. Comparing the current trend change to other signals shows one of the most significant drawdowns in history. After similar trend change drawdowns, the overall bear market decline looks troubling.
After other trend changes, the 1 to 12-month time frames show a negative return at some point in 14 out of 19 instances.
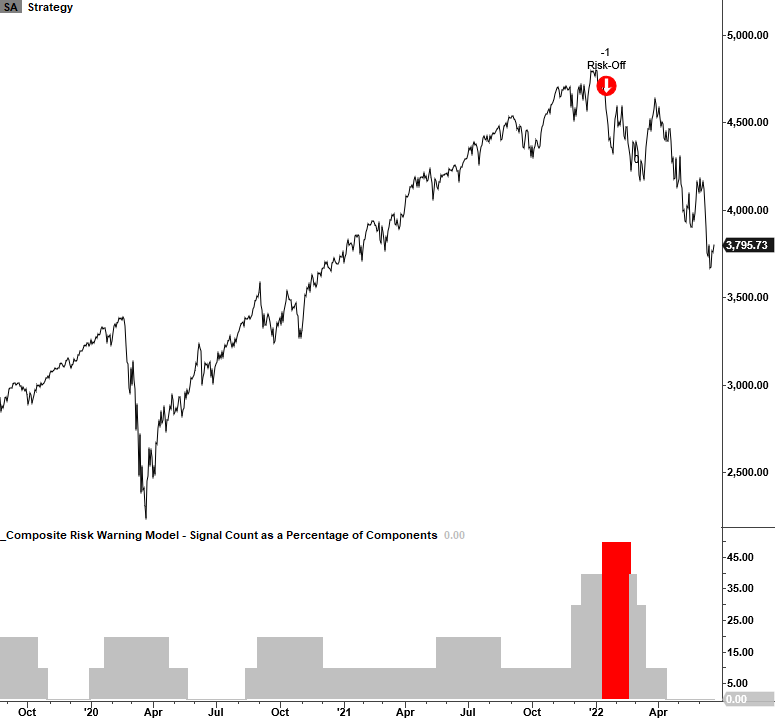
2. Composite Risk Warning Model - Neutral
To see published research about the risk warning model, click here.
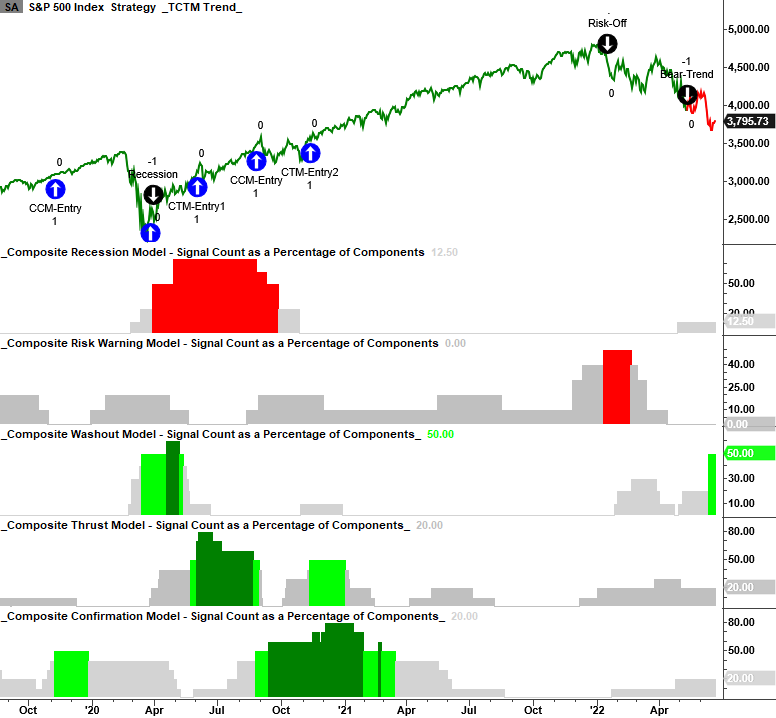
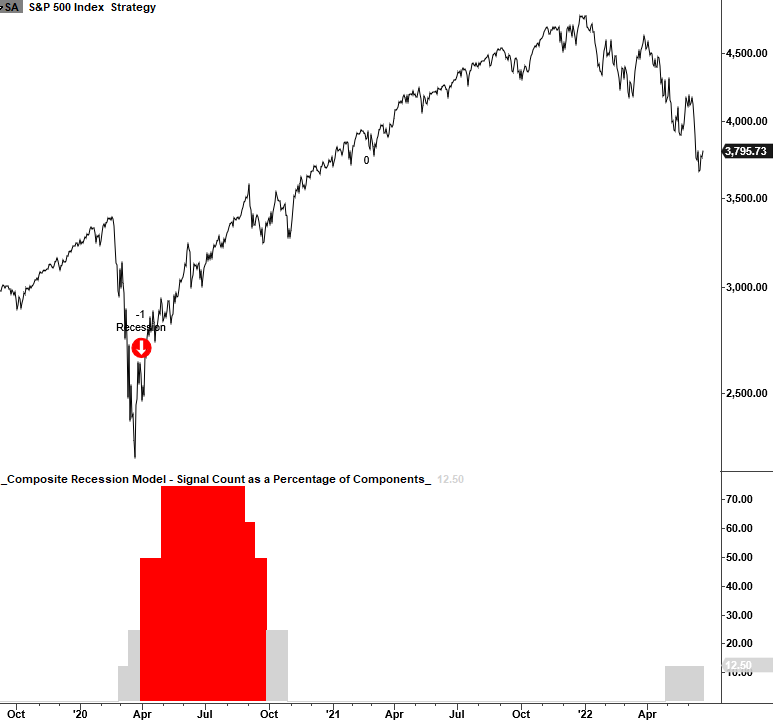
3. Composite Recession Model - Neutral
The composite recession model signal count increased to 12.5% with a new alert on 4/29/22.
Please click here to read the recession signal note.
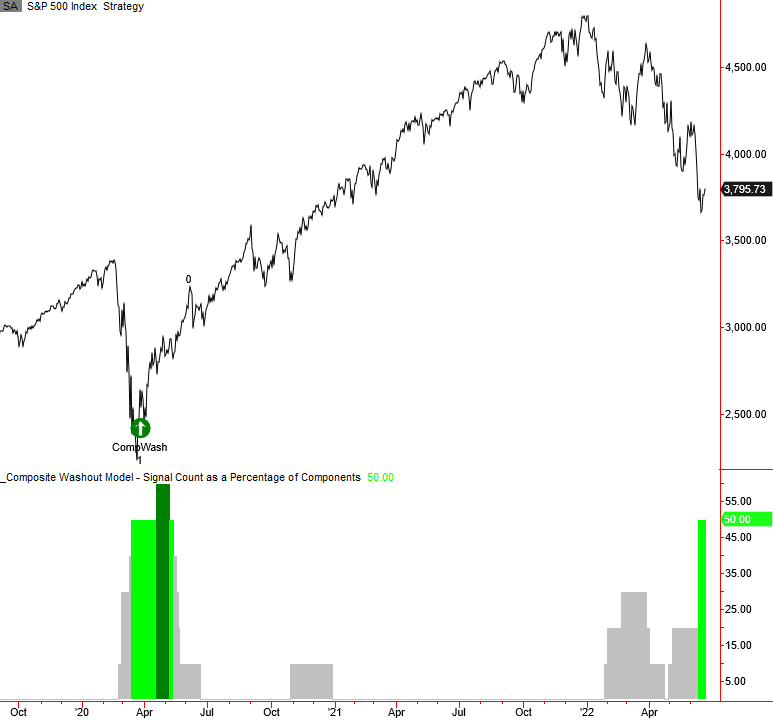
4. Composite Washout Model - Neutral
The composite washout model signal count increased to 50% with 3 new signals since 6/13/22. The model has now reached the signal threshold level. However, price momentum for the S&P 500 needs to turn positive before an alert can trigger.
- Absolute volatility model - Signal date = 5/6/22
- Percentage of issues at a 21-day low divergence - Signal date = 6/13/22
- Breadth Washout - Signal date = 6/14/22
- Volume Washout - Signal date = 6/14/22
- Percentage of issues oversold (14-day stochastic < 20) - Signal date = 6/14/22
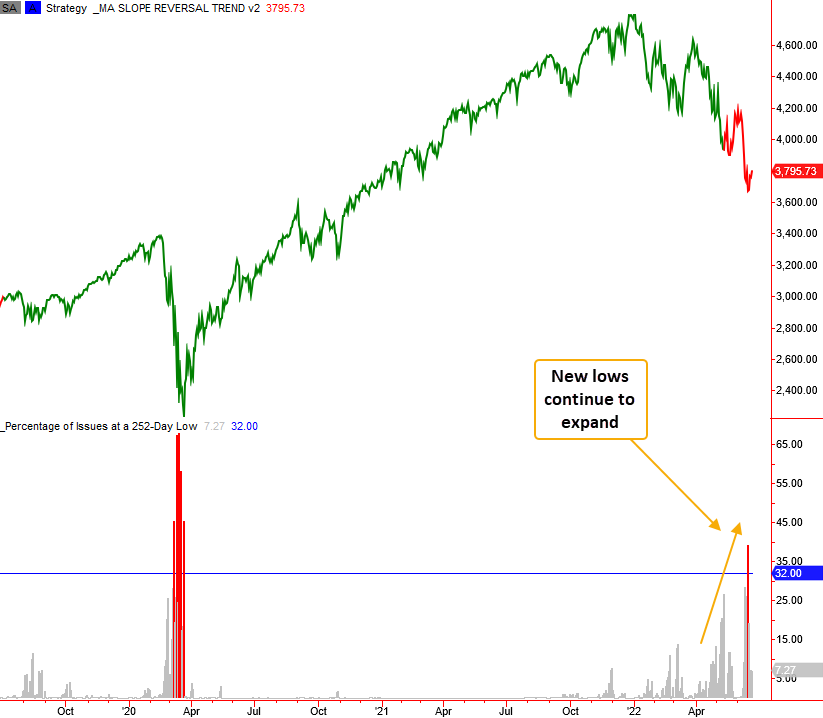
I would like to see a divergence signal from 63 & 252-day lows. Historically, markets bottom on a contraction in new lows, not when they are expanding, which is the case now.
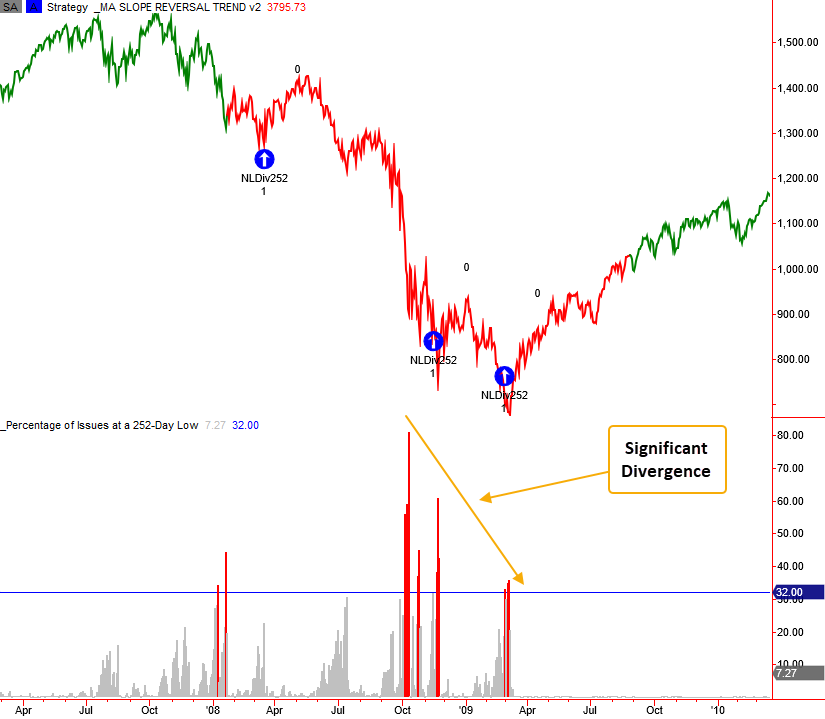
The 2007-08 bear market provides a great example of how markets typically bottom when new lows contract as indexes close at lower levels. i.e., a divergence
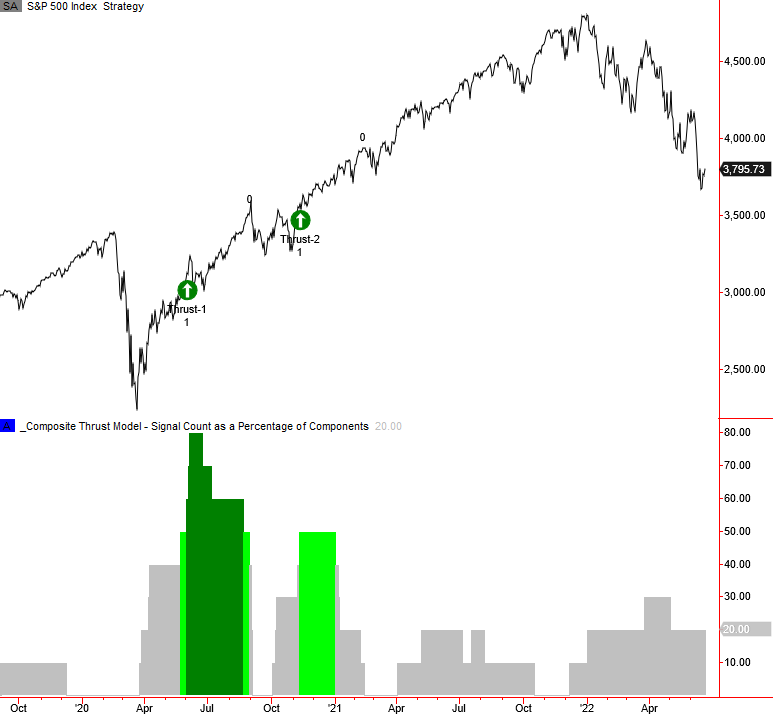
5. Composite Thrust Model - Neutral
I will be monitoring the thrust model for a buy signal. The signal count decreased to 20%, with the expiration of the percent above the 10-day average reversal signal.
6. Composite Confirmation Model - Neutral
The composite confirmation model signal count remains low. Once the current correction ends, I would watch this model as the signal count should increase as the recovery develops. The CCM typically lags during a rally as the components are big-picture algorithms that take more time to trigger.
7. Composite Master New Bull Market Model - Neutral
The composite master-bull-market model signal count remains low. Once the current correction ends, I would watch this model as the signal count should increase as the recovery develops. The composite score ticked up to 30% with an investment-grade bond thrust signal on 5/27/22.
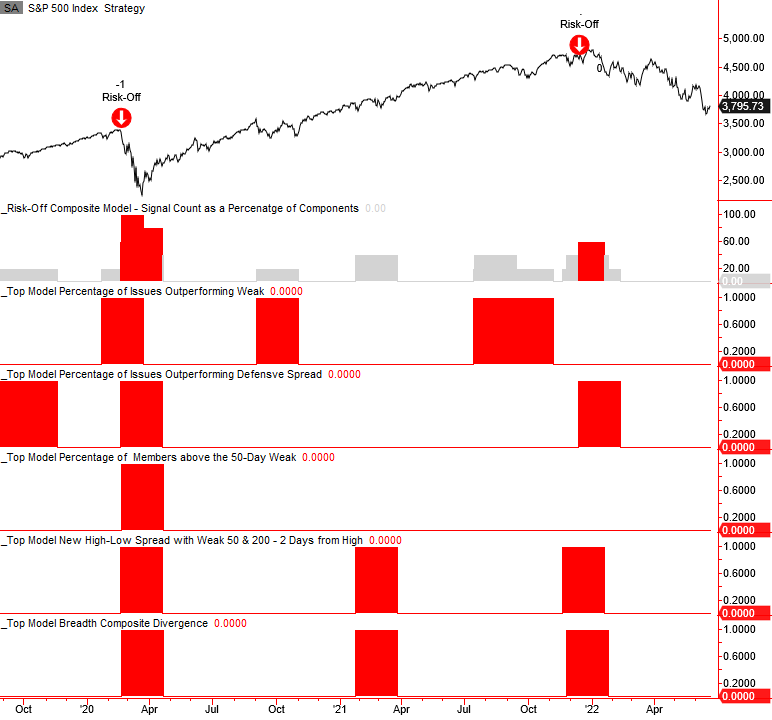
Risk-Off Composite Model - Neutral
The risk-off composite model is an excellent secondary tool for managing market exposure with the TCTM Risk Warning Model. Please click on the following link for a note on the model. Click here.
After triggering a risk-off signal in December, the composite count has fallen to zero with the expiration of all alerts.