Key points:
- A Composite Thrust Model signal triggered on 2022-11-30
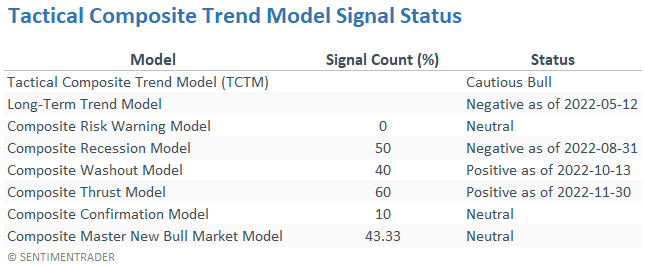
- The Long-Term Trend and Composite Recession Models remain negative
- The overall Tactical Composite Trend Model (TCTM) maintains a cautious bull outlook
To see any published research about this model, click here.
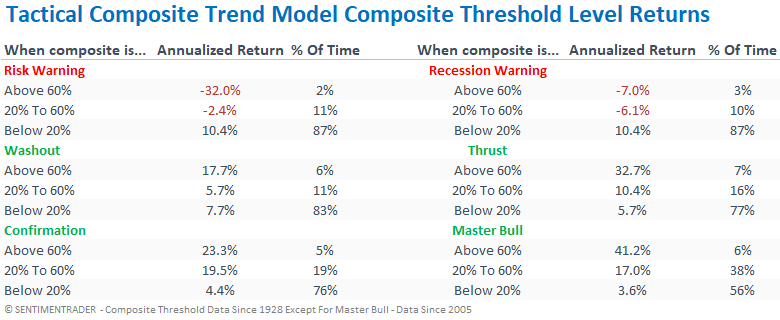
Composite Thrust Model - Positive
Breadth-based indicators, which comprise the Composite Thrust Model, have been strong since the low in October. With newfound participation from stocks after a Composite Washout Model signal, the CTM triggered a new alert on 2022-11-30, representing the second signal in three months, which is rare.
Component Signals:
- 2-Day Volume Ratio Thrust
- % of Issues above the 10-Day Reversal
- % of Issues at a 21-Day High Spike
- Breadth Thrust for S&P 500
- % of Issues Overbought Spike
- % of Issues above the 50-Day Surge
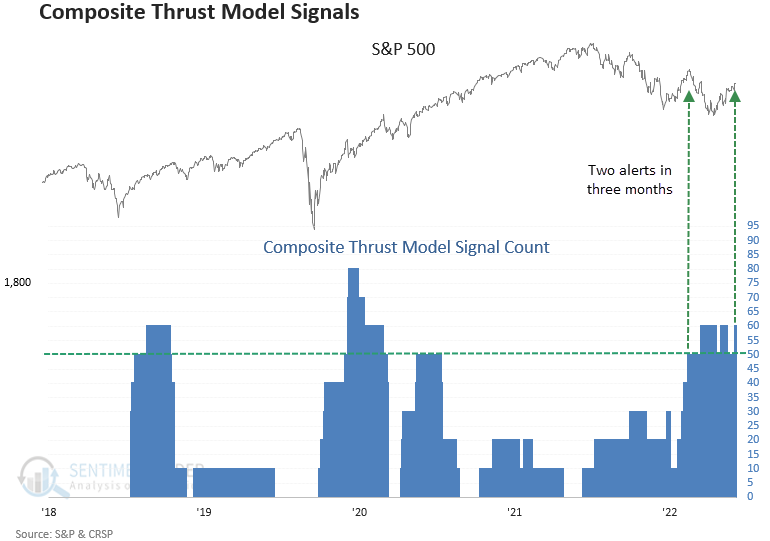
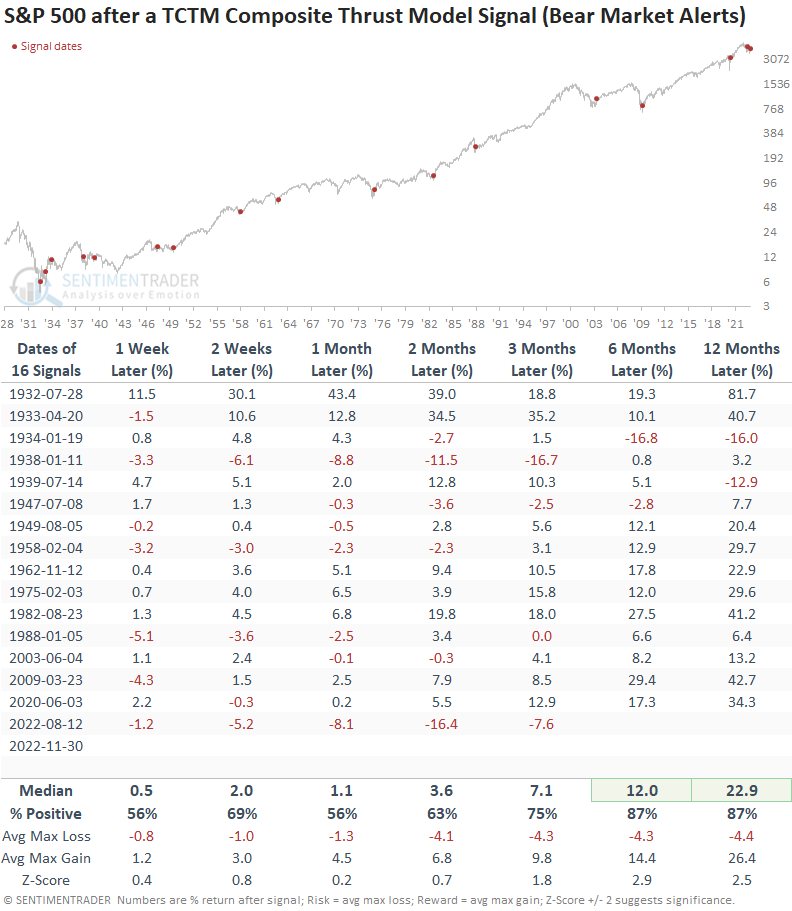
It's rare to see two CTM signals trigger within a little more than three months of each other. The previous alert occurred near the peak of the June to August bear market bounce, leading to the worst drawdown in history at the end of two months.
As I've discussed in a few notes, sometimes indicators/systems struggle in specific environments, which is the case now with breadth thrusts. Remember, no indicator is infallible. So, one must manage risks appropriately.
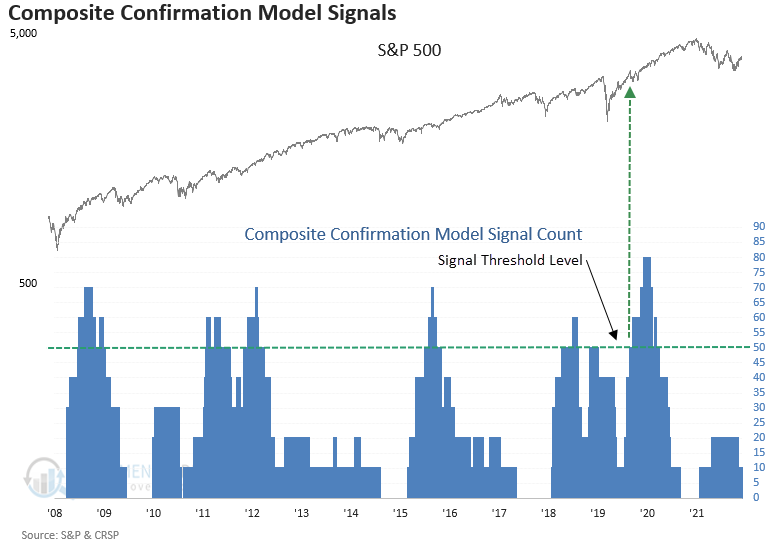
Composite Confirmation Model - Neutral
Since the last update, the Composite Confirmation Model signal count has decreased to 10%, which means the model will need significant improvement to issue a bullish confirmation alert.
When the model count eventually increases above the signal threshold level, I want to see the components based on economic indicators participate. A turn in the business cycle would be a bullish development.
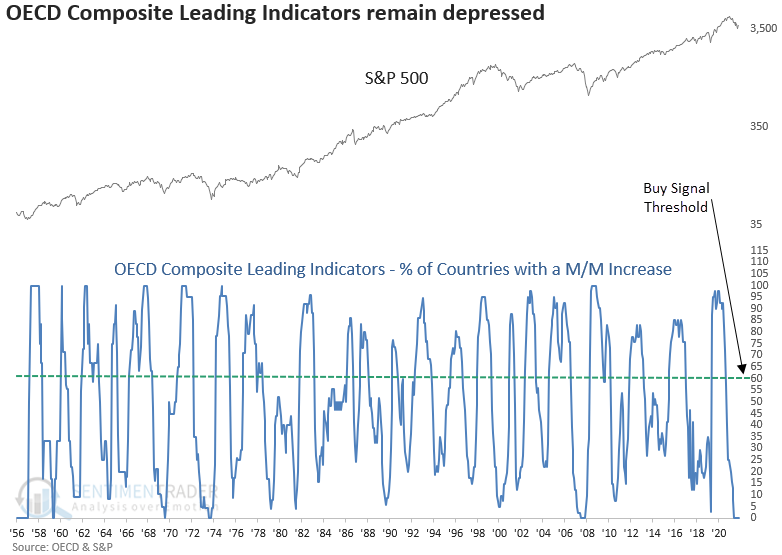
The OECD's Composite Leading Indicators is one business cycle component in the CCM that I'm watching closely for an alert. The diffusion index has now been pinned on zero for six consecutive months, matching the longest streak in history, which occurred from May to October 2008.
Composite Washout Model - Positive
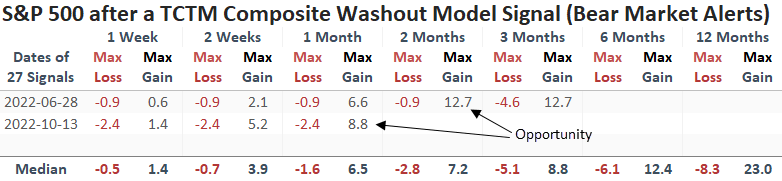
The August Composite Thrust Model signal experienced a significant drawdown, and it's too early to judge the new alert from last week. However, the Composite Washout Model has done an excellent job of capturing two important counter-trend rallies this year.
Please click here to see the most recent CWM signal note.
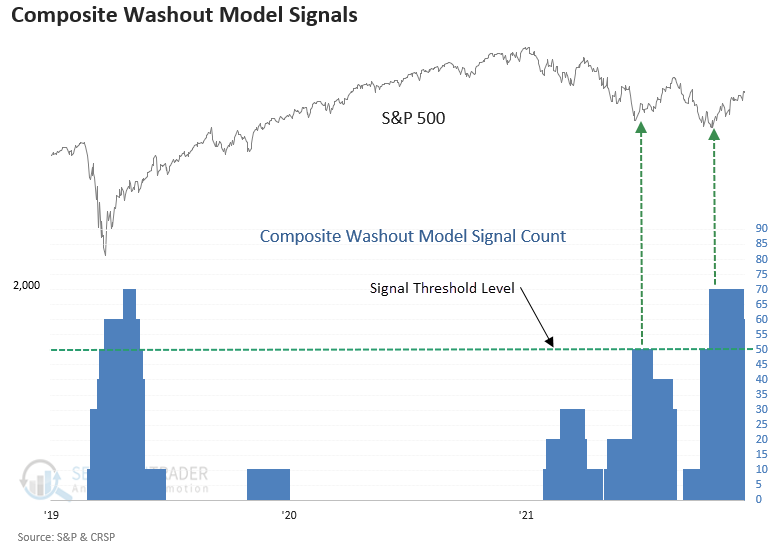
The June Composite Washout Model signal led to a substantial counter-trend rally over a multi-month period. So far, the October alert is up almost 9% through 2022-12-05.
Long-Term Trend Model - Negative
From a big-picture perspective, one must remember that the Long-Term Trend Model for the S&P 500 is negative. An immediate trend change is unlikely, with the 200-day moving average declining and negative price momentum.
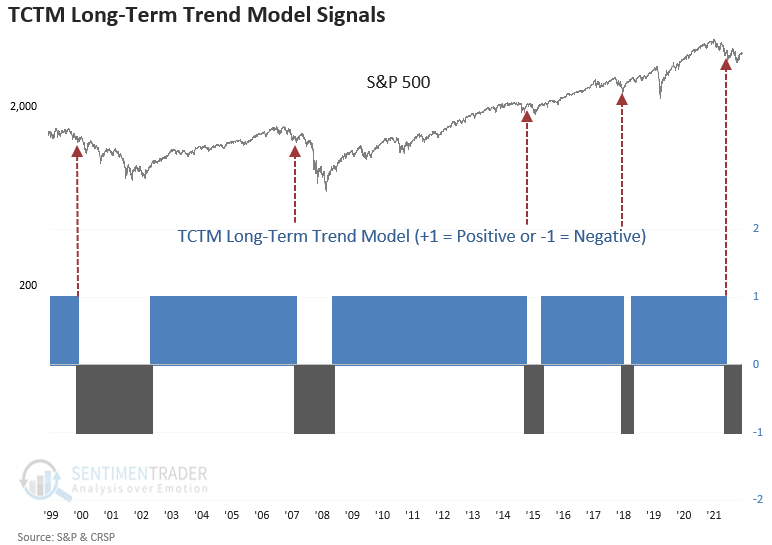
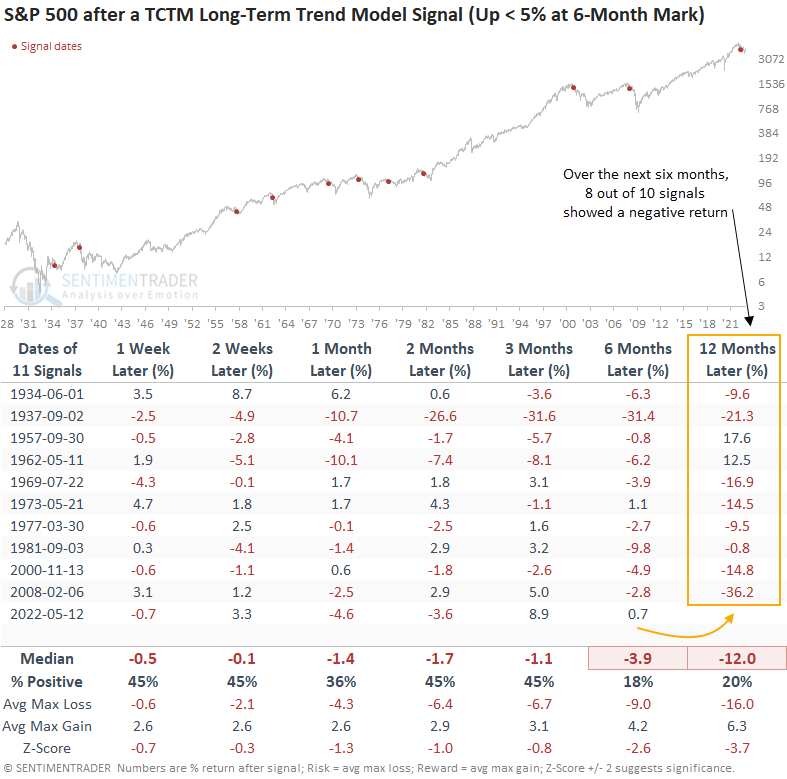
Since the Long-Term Trend Model turned negative in May, the S&P 500 has gained 0.7% through the first six months. The following table contains all signals whereby the S&P 500 was up less than 5% at the end of six months, which is the case now.
The inability of the S&P 500 to rally more than 5% over six months does not bode well for the next six months.
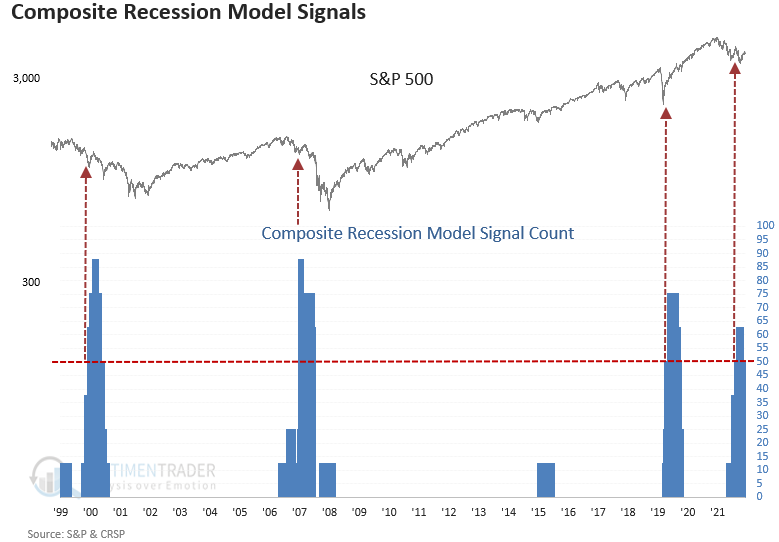
Composite Recession Model - Negative
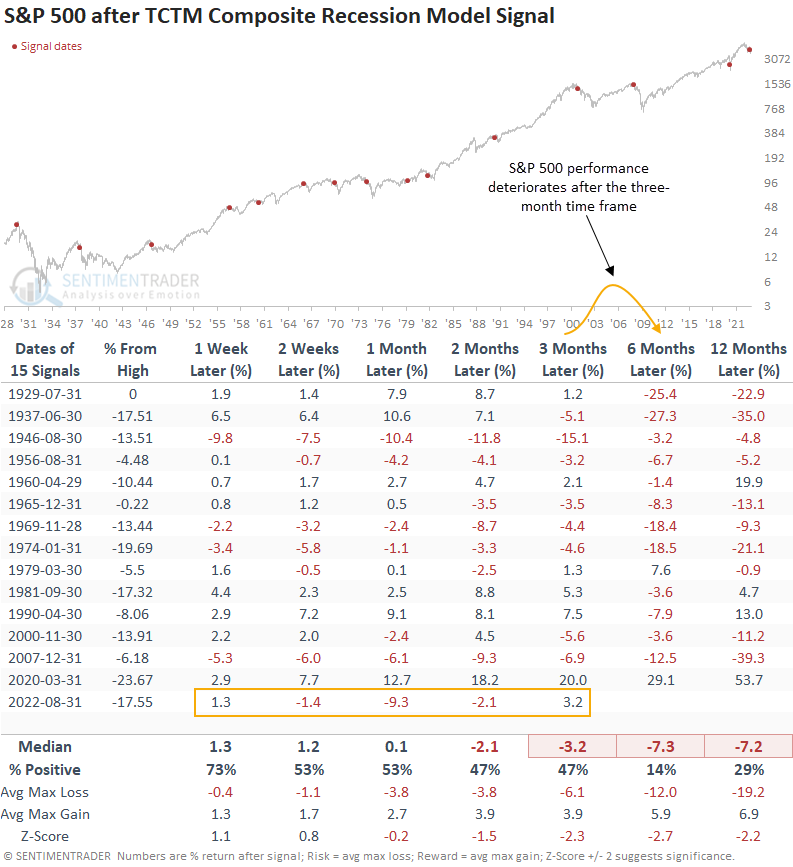
The Composite Recession Model triggered the 16th alert since 1929 at the end of August.
Bear markets associated with recessions typically experience more significant drawdown phases.
With the S&P 500 closing out a 3% gain at the end of three months, one must be mindful that performance deteriorates in a meaningful way over the next three months.
What the research tells us...
With the new Composite Thrust Model signal, the TCTM status will remain with a cautious bull outlook. It will stay with that view for the next three months. Suppose the long-term trend model turns positive between now and the expiration of the thrust window. In that case, the overall TCTM status will turn bullish. However, should the long-term trend model remain negative and the thrust window expires, the TCTM status would revert to bearish. So, the TCTM model goes against the prevailing negative trend for a limited time.
About the TCTM
The Tactical Composite Trend Model (TCTM), created by Dean Christians, represents decades of professional trading and financial market research. The TCTM aims to provide traders and investors with key signals around identifiable market turning points.