Key points:
- The TCTM long-term trend model turned negative on 5/12/22
- With the trend change, the TCTM status moved from cautious bull to negative
- A washout model signal triggered on 6/28/22
- The recession composite model count increased to 37.5%, with two new alerts on 6/30/22
- The composite thrust model count increased to 30%, with two new alerts since 7/19/22
Data as of 7/29/22.
| MODEL | Signal Count % | STATUS |
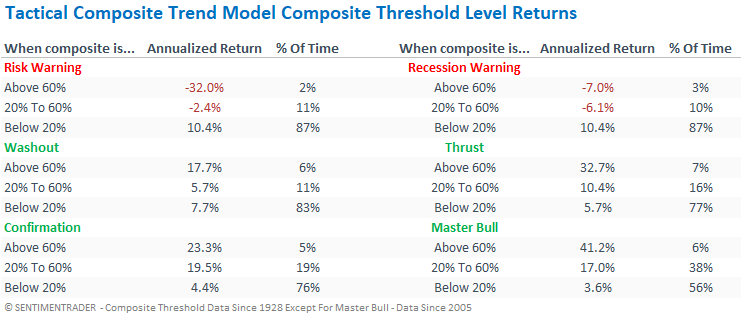
| Tactical Composite Trend Model (TCTM) | Negative | |
| Long-Term Trend Model | Negative as of 5/12/22 | |
| Composite Risk Warning Model | 0 | Neutral |
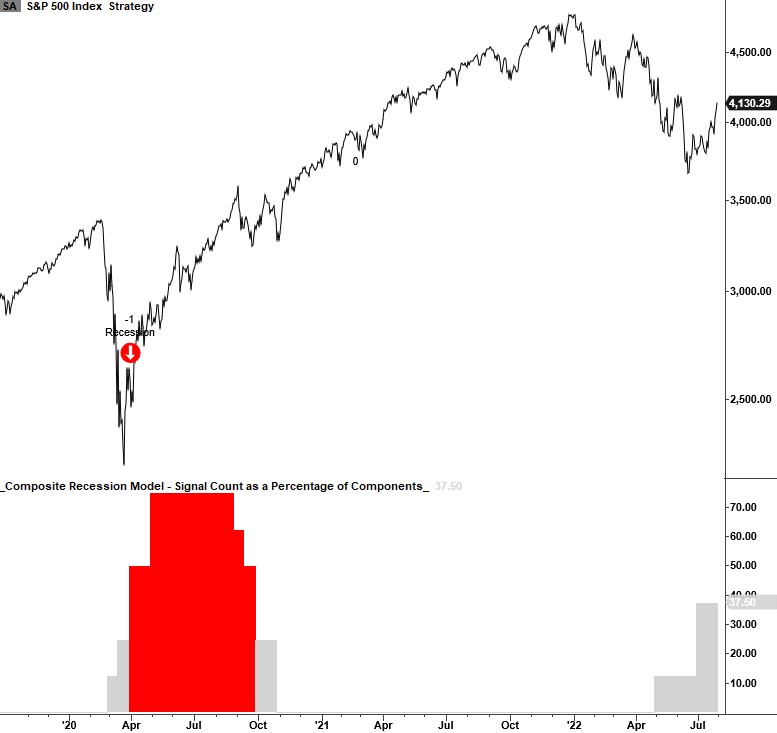
| Composite Recession Model | 37.5 | Neutral |
| Composite Washout Model | 40 | Neutral |
| Composite Thrust Model | 30 | Neutral |
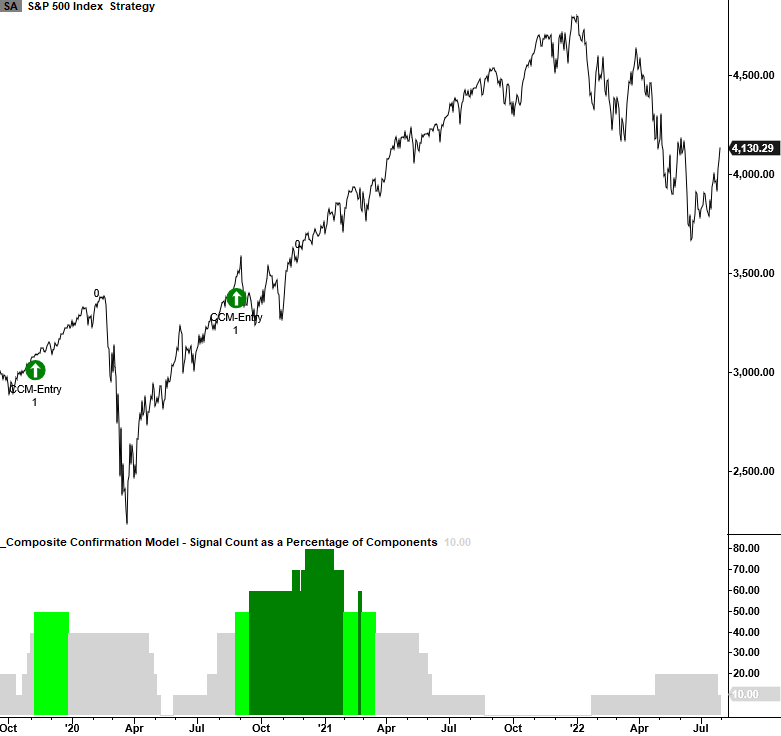
| Composite Confirmation Model | 10 | Neutral |
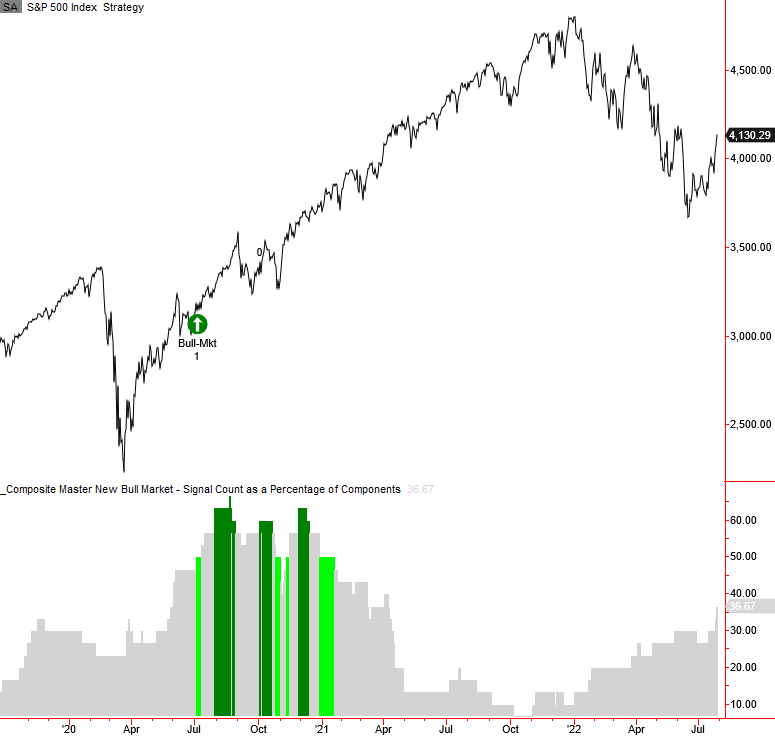
| Composite Master New Bull Market Model | 36.67 | Neutral |
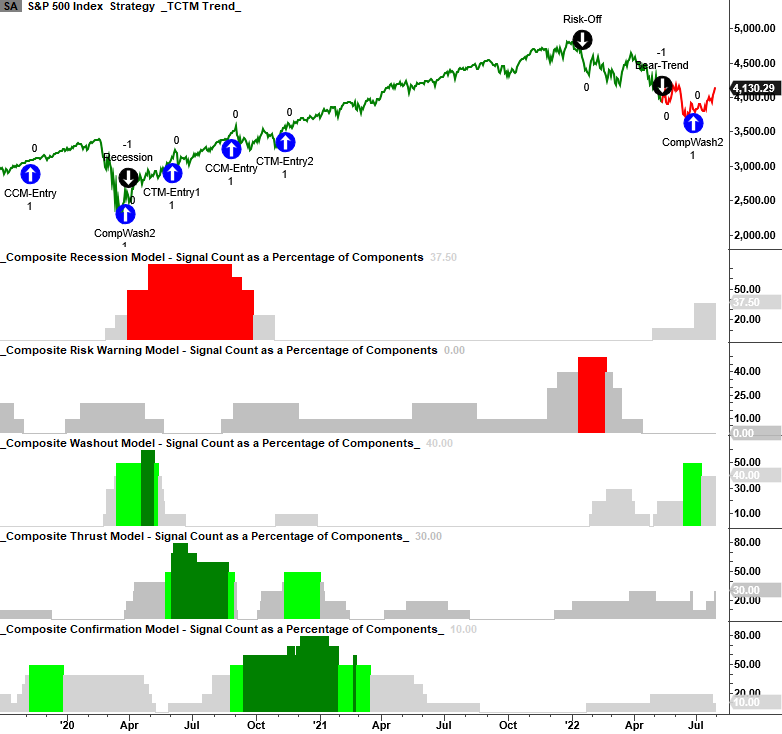
Tactical Composite Trend Model - Bearish
The TCTM long-term trend model flipped from bullish to bearish on 5/12/22. The trend change moves the overall TCTM status from cautious bull to negative. On 6/28/22, the composite washout model triggered a new alert. While the CWM has a solid record of identifying a turning point around significant lows, it cannot change the TCTM status in a bear market. I use it as a counter-trend rally tool. The only thing that can change the TCTM status from here on out is a long-term trend model change or a composite thrust signal. The recession model count is inching up. It's now 37.5%. I would be mindful of a potential recession, which typically means the market experiences a more significant drawdown. The good news is the composite thrust model now stands at 30%, with two new alerts since 7/19/22.
The TCTM is not a pure black-box model that says we should be all in or out. And it should act as a complementary tool to your research process.
To see any published research about this model, click here.
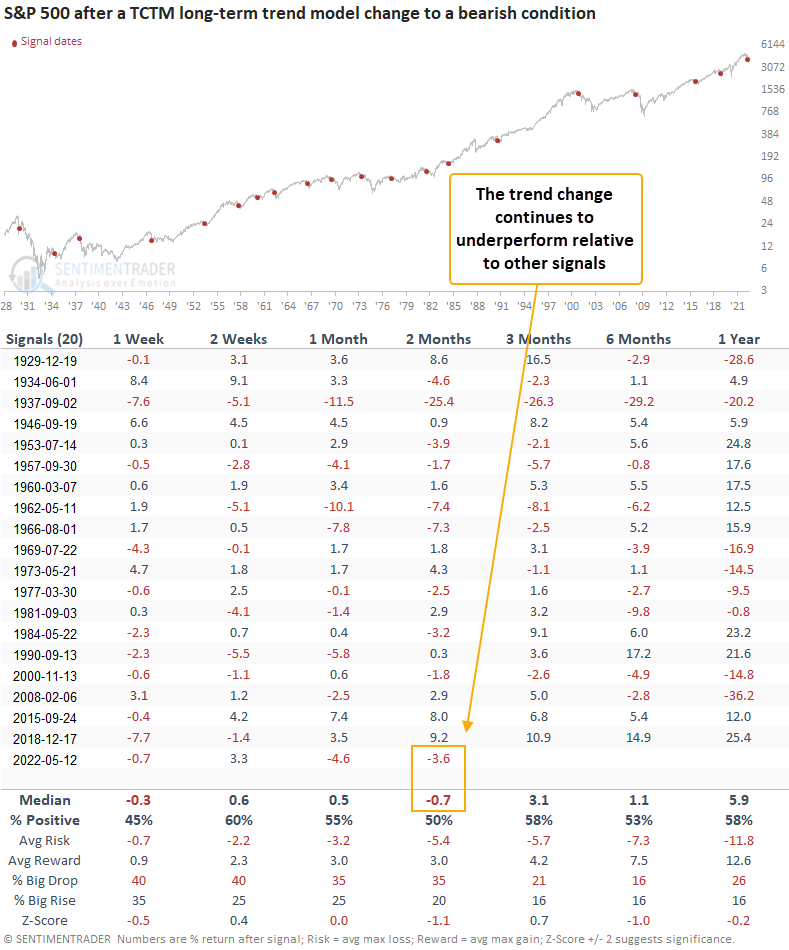
1. Long-Term Trend Model - Bearish
The long-term trend model turned bearish on 5/12/22. Annualized returns are unfavorable when the model is negative.
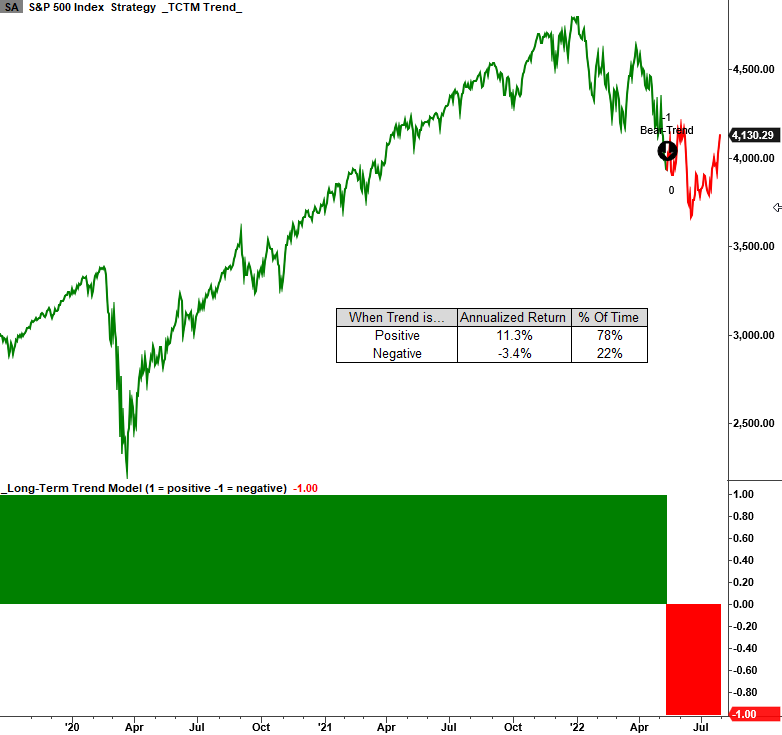
After other trend changes, the 1 to 12-month time frame shows a negative return at some point in 14 out of 19 instances.
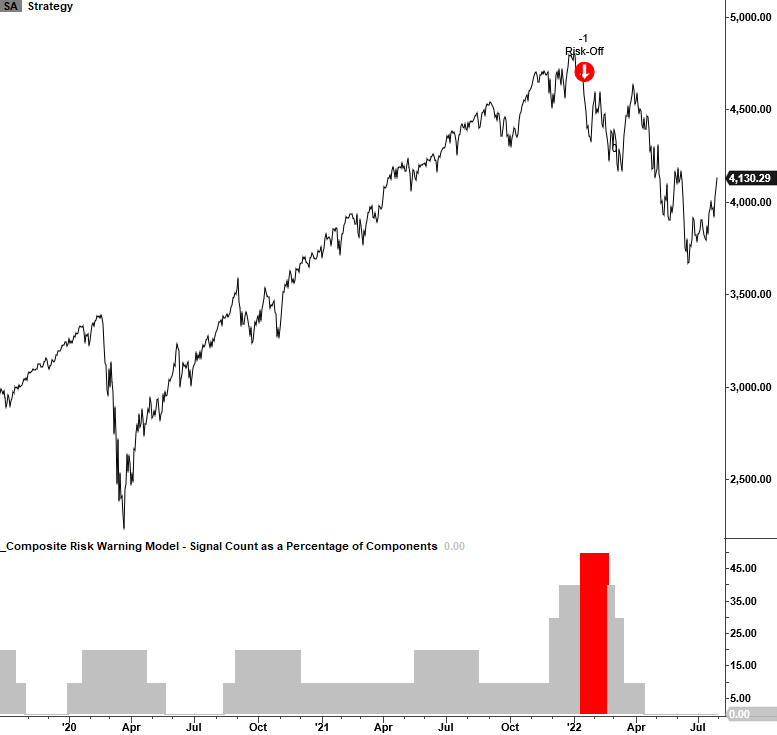
2. Composite Risk Warning Model - Neutral
To see published research about the risk warning model, click here.
3. Composite Recession Model - Neutral
The composite recession model signal count increased to 37.5% with two new alerts on 6/30/22.
Signal Notes:
4. Composite Washout Model - Neutral
The composite washout model issued a new alert on 6/28/22 when price momentum for the S&P 500 turned favorable. Please click here to see the CWM signal note.
Signals:
- Absolute volatility model - Signal date = 5/6/22
- Percentage of issues at a 21-day low divergence - Signal date = 6/13/22
- Breadth Washout - Signal date = 6/14/22
- Volume Washout - Signal date = 6/14/22
- Percentage of issues oversold (14-day stochastic < 20) - Signal date = 6/14/22
While the CWM triggered a new alert, we did not see a divergence signal from the 63 & 252-day low components. Historically, markets bottom when new lows are contracting, not expanding, which is the case now. Please click here to see a note about divergence signals.
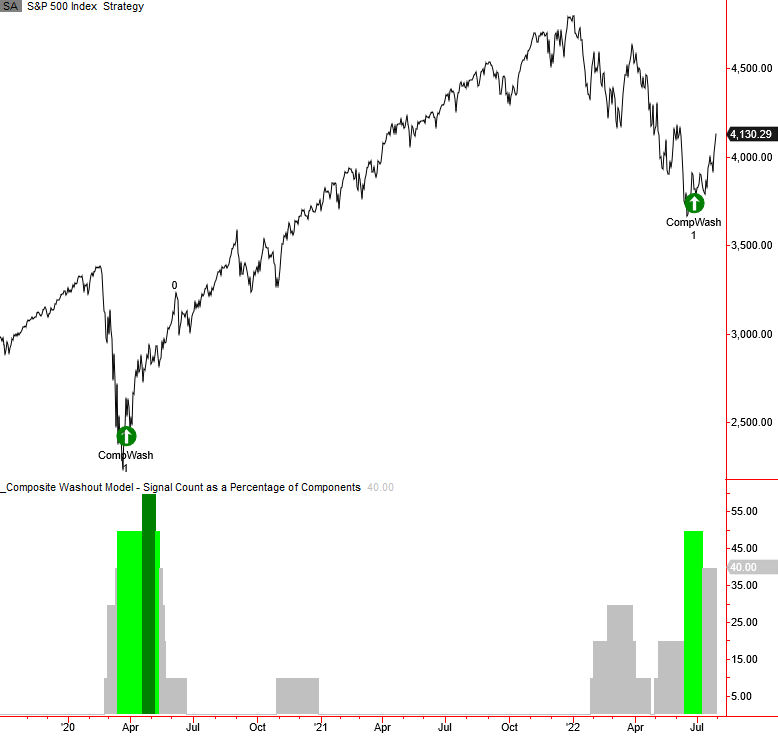
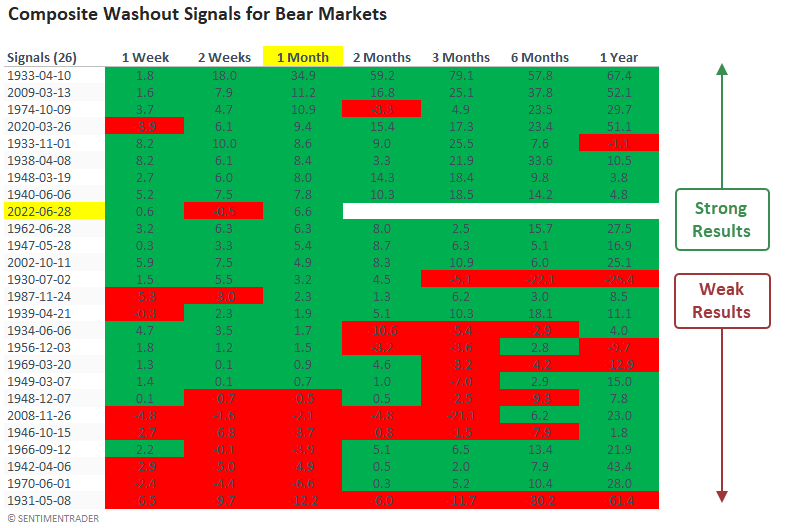
The composite washout model signal from 6/28/22 shows the 9th best gain for bear market instances at the 1-month mark, with a return of 6.6%.
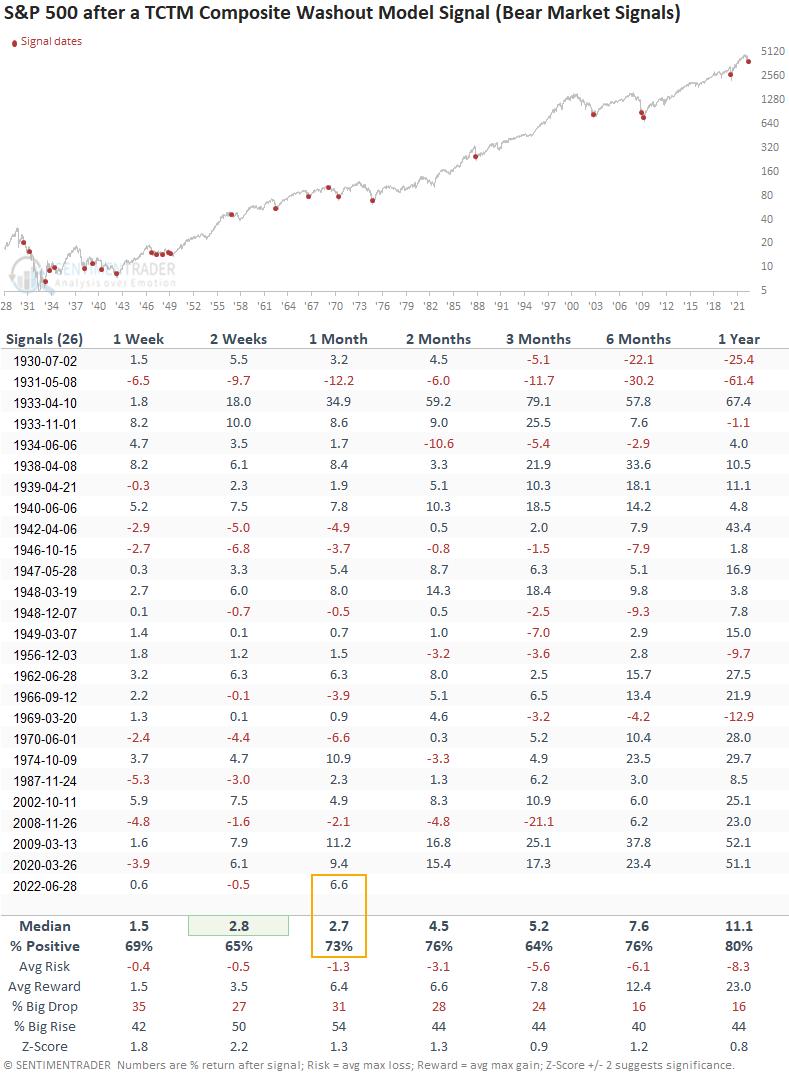
When the washout signal gains 5% or more in the first month, which is the case now, forward returns look significantly better than instances where the alert registered lower returns.
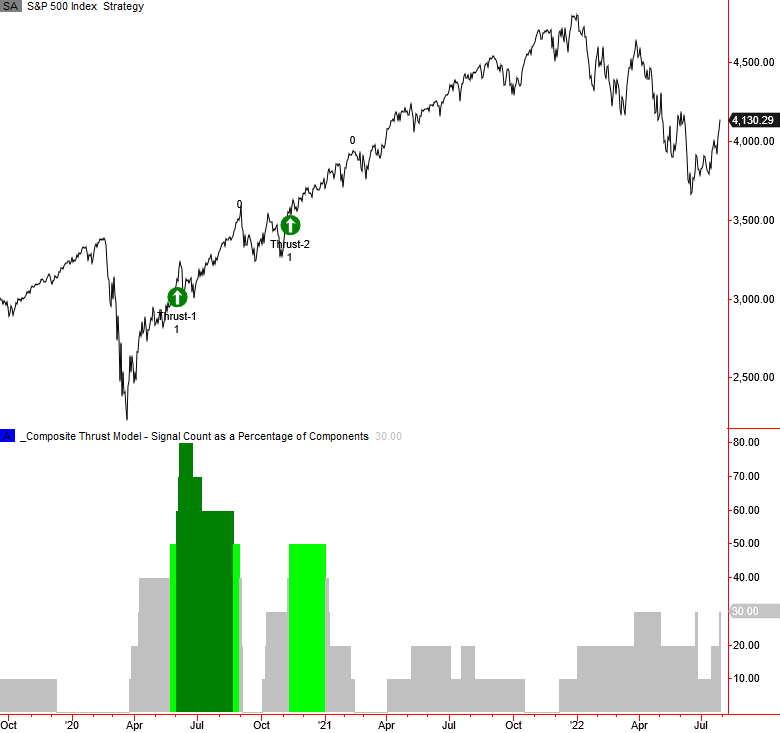
5. Composite Thrust Model - Neutral
I will be monitoring the thrust model for a buy signal. The signal count increased to 30%, with two new alerts since 7/19/22.
- Percent of members above the 10-day reversal - signal date 6/24/22
- 2/3 volume ratio - signal date 7/19/22
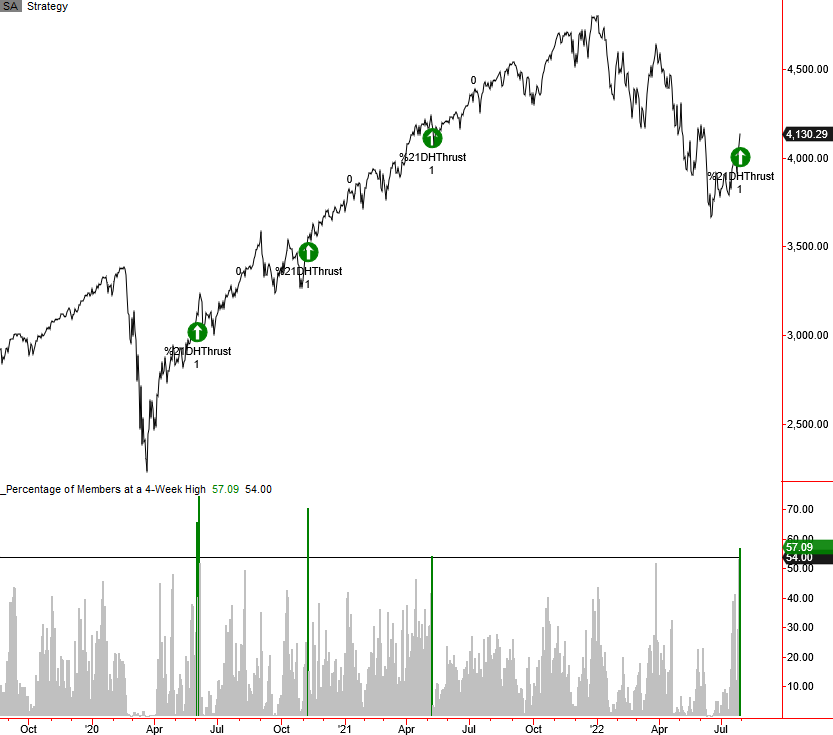
- Percent of issues at a 4-week high - signal date 7/29/22
A composite thrust model signal will change the TCTM status from negative to positive.
The percentage of issues at a 4-week high model triggered a buy signal on 7/29/22. If you followed the backtest engine scan I shared in the 4-week high concept note, that alert occurred on 7/28/22. The signal date difference is because my calculation uses 21 days, whereas the website calculation is 20 days.
6. Composite Confirmation Model - Neutral
The composite confirmation model signal count remains low. Once the current bear market ends, I would watch this model as the signal count should increase as the recovery develops. The CCM typically lags during a rally as the components are big-picture algorithms that take more time to trigger.
7. Composite Master New Bull Market Model - Neutral
The master-bull-market composite score increased to 36.67% with the addition of the thrust model signals. Once the current bear market ends, I would watch this model as the signal count should increase as the recovery develops.
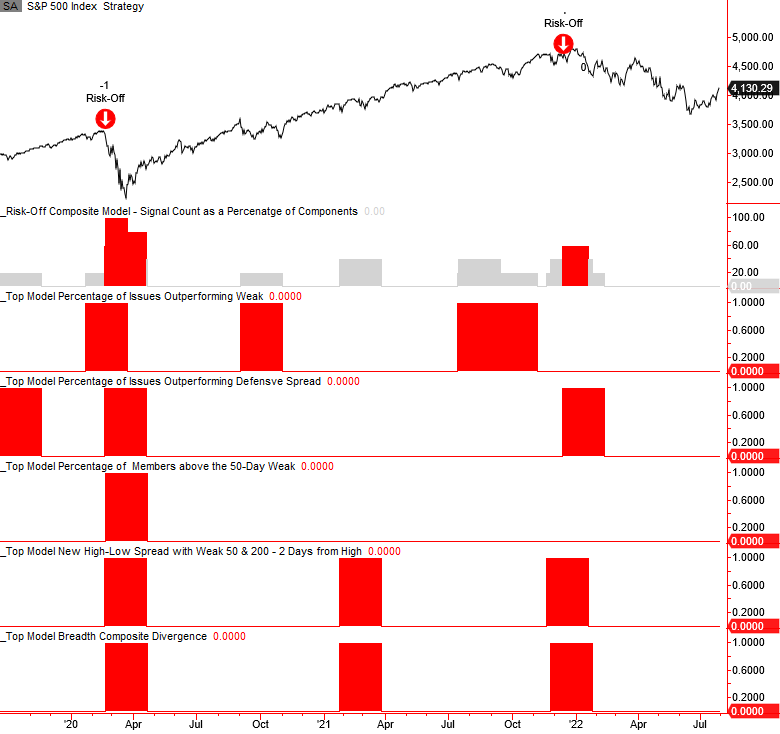
Risk-Off Composite Model - Neutral
The risk-off composite model is an excellent secondary tool for managing market exposure with the TCTM Risk Warning Model. Please click on the following link for a note on the model. Click here.
After triggering a risk-off signal in December, the composite count has fallen to zero with the expiration of all alerts.