I will distribute updates to the Tactical Composite Trend Model via a published note on a go-forward basis.
Data as of 4/13/22.
| MODEL | Signal Count % | STATUS |
| Tactical Composite Trend Model | Cautious Bull as of 1/18/22 | |
| Long-Term Trend Model | Bullish | |
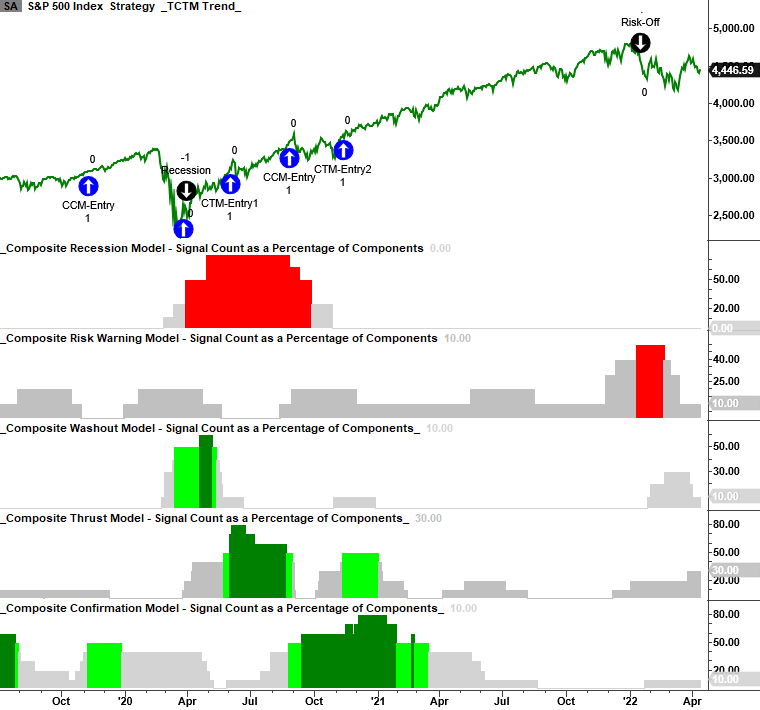
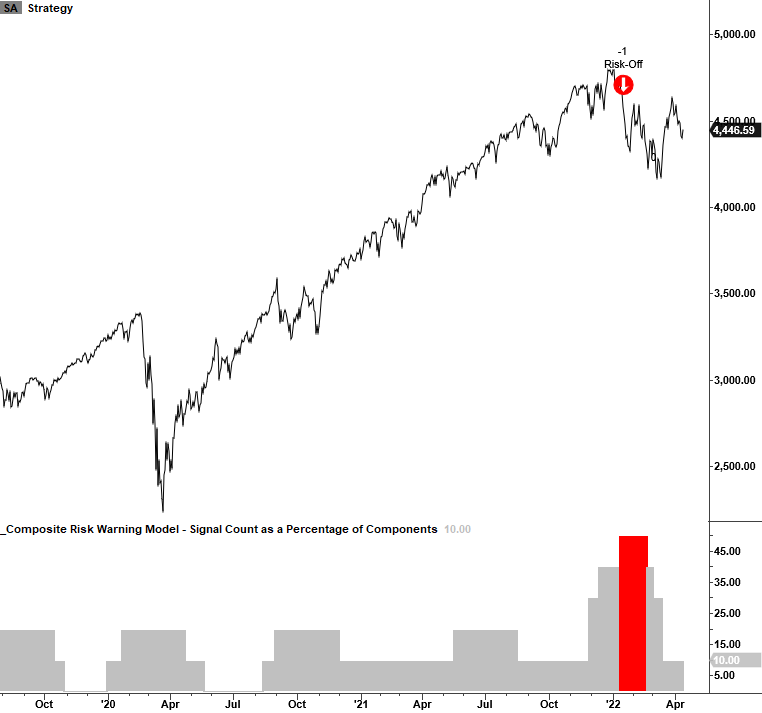
| Composite Risk Warning Model | 10 | Bearish as of 1/13/22 |
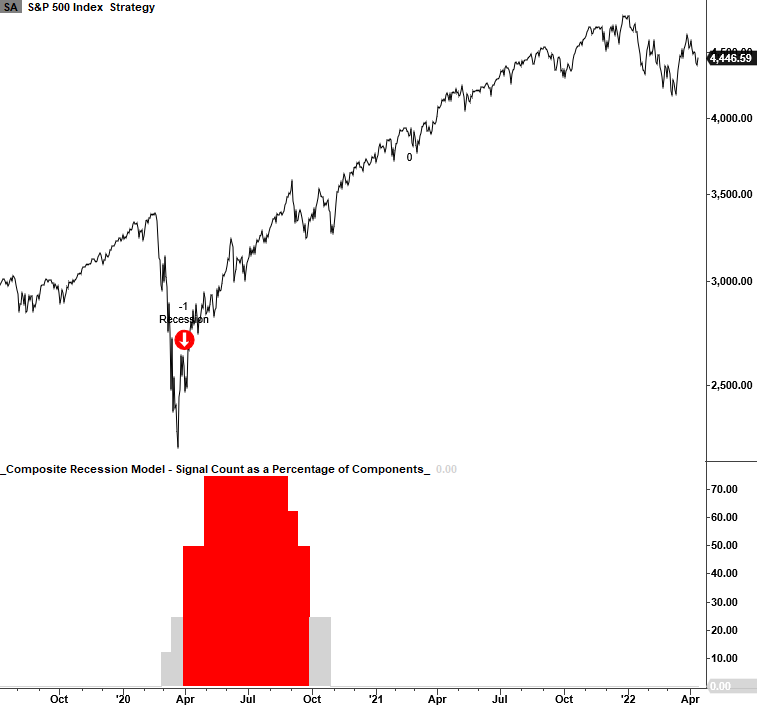
| Composite Recession Model | 0 | Neutral |
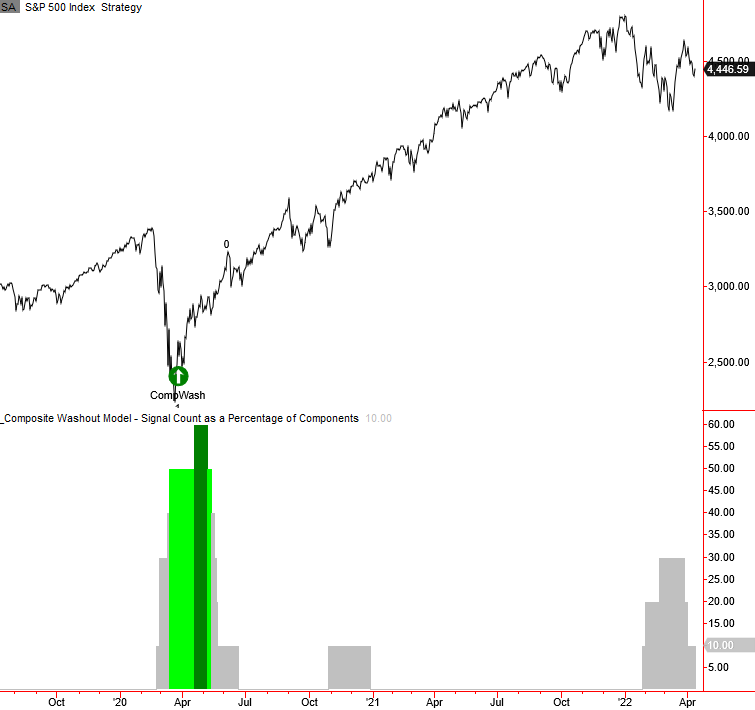
| Composite Washout Model | 10 | Neutral |
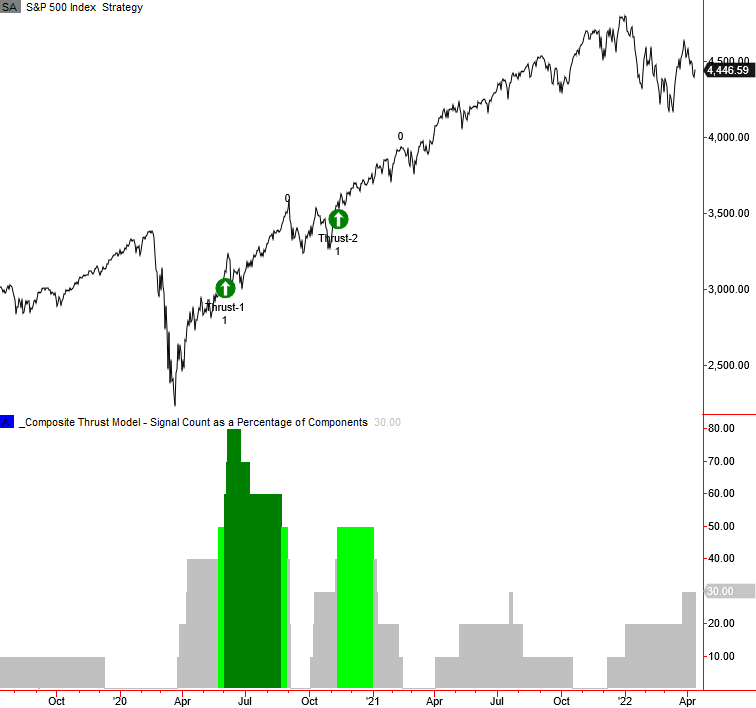
| Composite Thrust Model | 30 | Neutral |
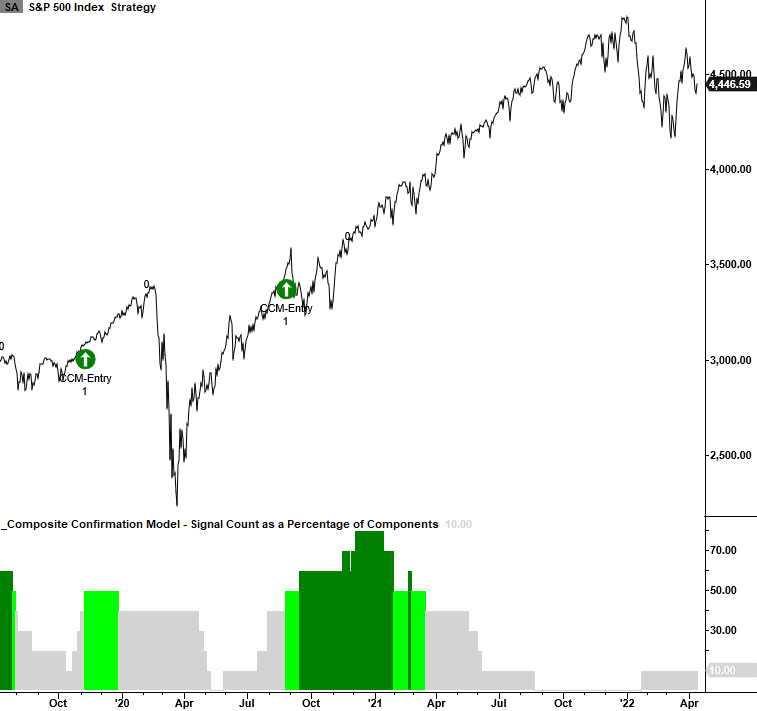
| Composite Confirmation Model | 10 | Neutral |
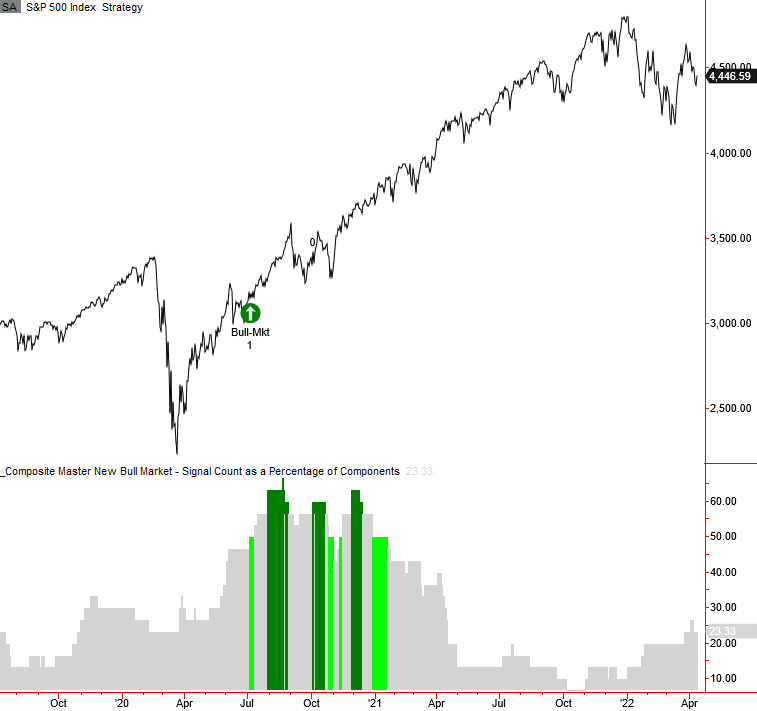
| Composite Master New Bull Market Model | 23.633 | Neutral |
Tactical Composite Trend Model - Cautious Bull
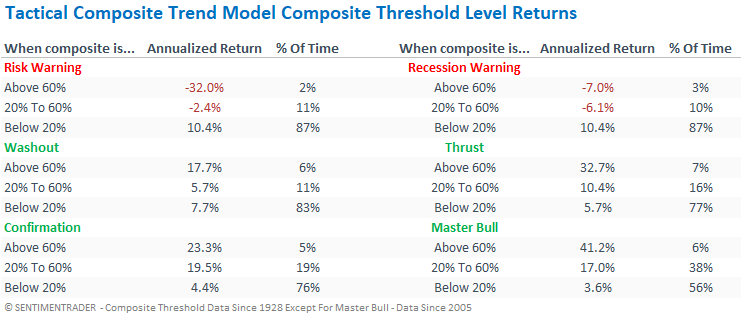
The TCTM maintains a cautious bull status as the recession and long-term trend models remain in a favorable position despite the composite risk warning model signal. Now that the market has corrected, I will be monitoring the washout and thrust models for indications that the countertrend move in the market is over.
The TCTM is not a pure black-box model that says we should be all in or out. And it should act as a complementary tool to your research process.
To see any published research about this model, click here.
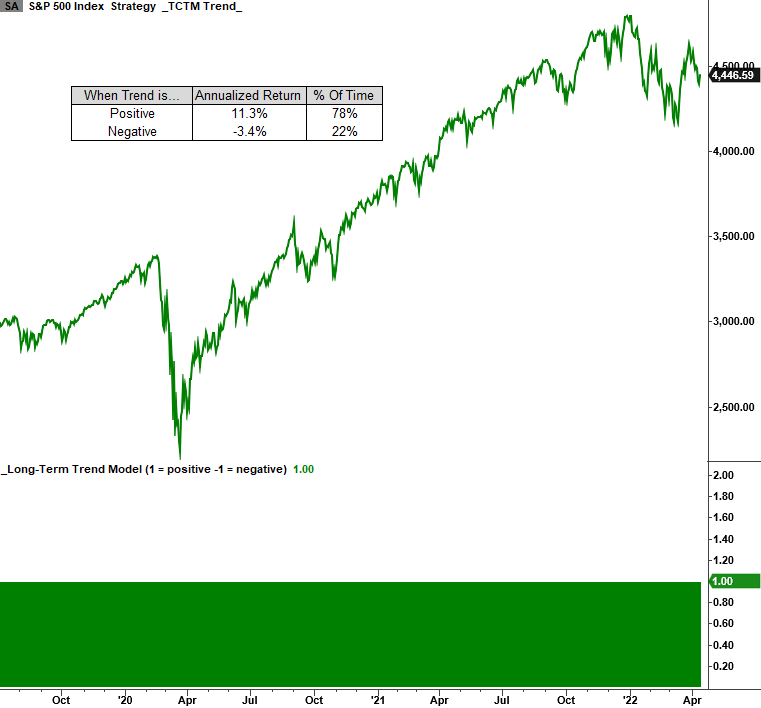
1. Long-Term Trend Model - Bullish
The long-term trend model remains in a bullish position. Annualized returns are favorable when the model is positive.
2. Composite Risk Warning Model - Bearish
The composite count has now fallen to 10% with the expiration of additional components.
Please click on the following links if you would like to read the notes for the components that triggered the risk-off signal.
- New Lows Spike Model
- 52-Week Low with Percent above 200-Day Model
- New 52-Week High Low Ratio Model
- Advance-Decline Line Divergence
To see published research about the risk warning model, click here.
3. Composite Recession Model - Neutral
While we've seen some less than robust economic data of late, I would not expect any changes to the recession model count for now.
4. Composite Washout Model - Neutral
After increasing to as high as 30%, the composite washout model signal count has fallen to 10%.
5. Composite Thrust Model - Neutral
I will be monitoring the thrust model for a buy signal. The signal count increased to 30%, with 3 new alerts triggering since 2/2/22.
- Percent above 10-day average reversal on 2/2/22
- Breadth Thrust on 3/28/22
- Rate of Change Thrust on 3/28/22
6. Composite Confirmation Model - Neutral
The composite confirmation model signal count remains low. Once the current correction ends, I would watch this model as the signal count should increase as the recovery develops. The CCM typically lags during a rally as the components are big-picture algorithms that take more time to trigger.
7. Composite Master New Bull Market Model - Neutral
The composite master-bull-market model signal count remains low. Once the current correction ends, I would watch this model as the signal count should increase as the recovery develops.
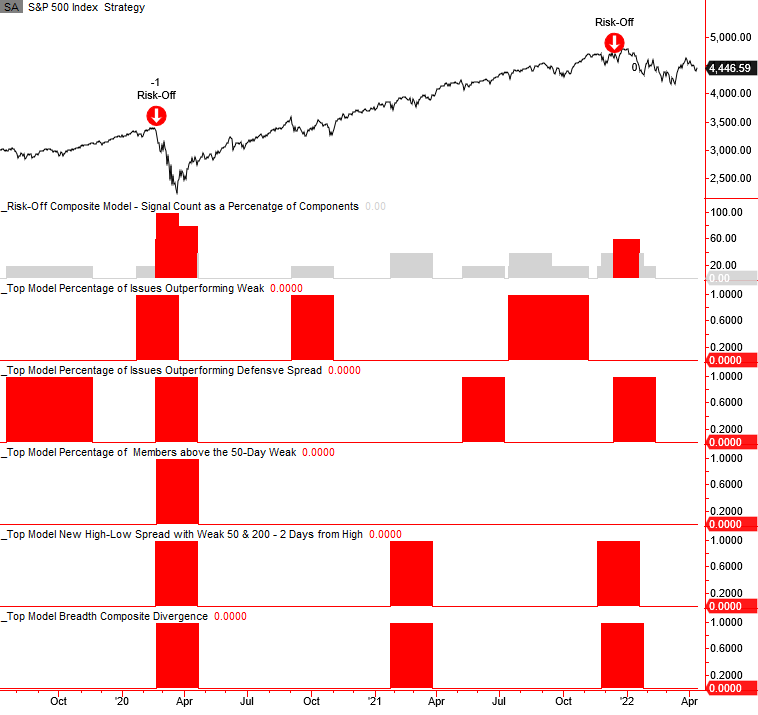
Risk-Off Composite Model - Neutral
The risk-off composite model is an excellent secondary tool for managing market exposure with the TCTM Risk Warning Model. Please click on the following link for a note on the model. Click here.
After triggering a risk-off signal in December, the composite count has fallen to zero with the expiration of all alerts.