
T-Bonds Meet the Month of Febraury

Key Points:
- T-bonds have long tended to experience a split personality in terms of performance during February
- The earlier part of February has tended to experience weakness during the first fourteen trading days of February, and strength after that
- Traders may benefit from focusing on the short side of the t-bond market during the first part of the month, and the long side thereafter
T-bonds tend to struggle late winter into early spring
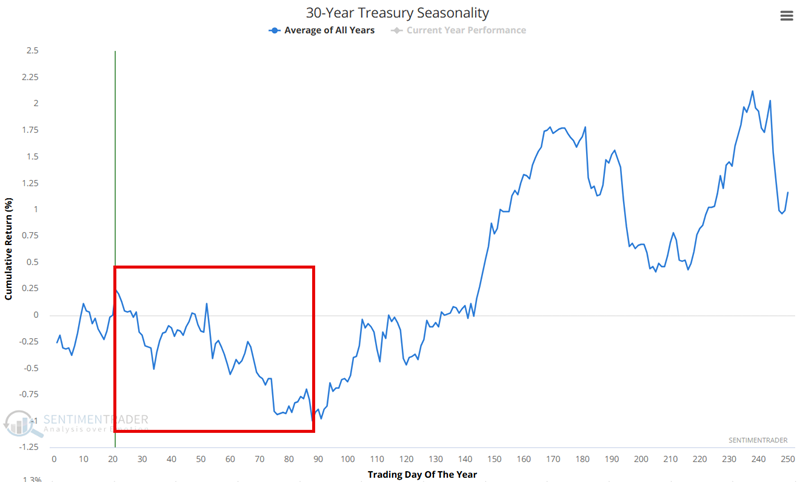
The chart below shows the annual seasonal trend for Treasury bond futures. While year-to-year results can vary greatly, we can see a strong tendency for weakness during late winter into early spring.
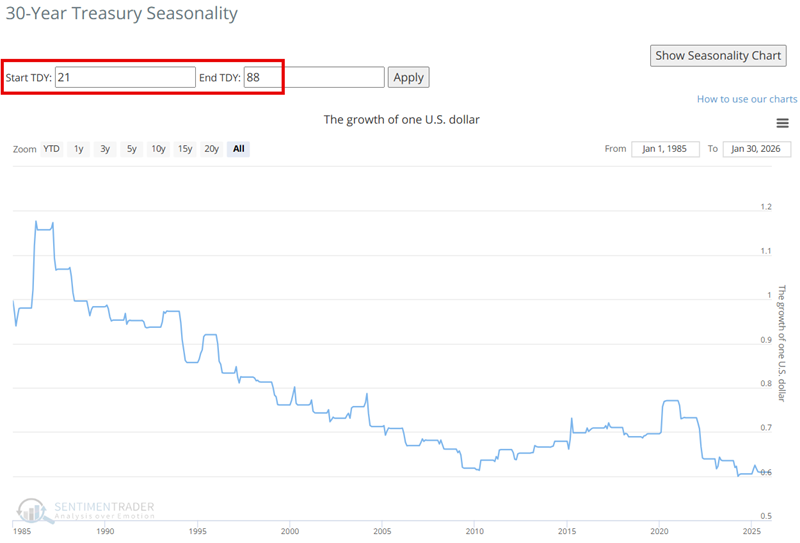
The chart below shows the hypothetical growth of $1 invested in 30-year t-bonds from Trading Day of the Year #21 through TDY #88, every year since 1985.
Now let's focus specifically on the calendar month of February.
T-bonds February "Jekyll and Hyde" personality
Few traders are fully aware of t-bonds' "split personality" in February. So, let's spell it out as succinctly as possible:
- February trading days 1 through 14 = Bad
- February trading days 15+ = Good
Data Note: The following results are calculated by using the daily dollar value change for the front 30-year treasury bond month. Each point on a T-bond futures contract is worth $1,000. So, if the contract price rises from 101.00 to 102.00, the contract value increases from $100,000 to $101,000, and the daily dollar value change for that day is $1,000. The results below are purely hypothetical and do not include deductions for slippage or commissions. The purpose is strictly to highlight future performance during specific periods of time.
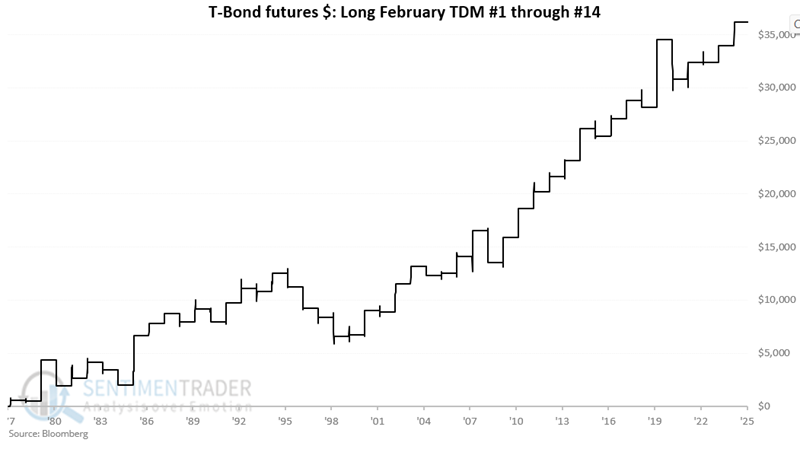
First, let's look at how t-bonds perform during February trading days #1 through 14.
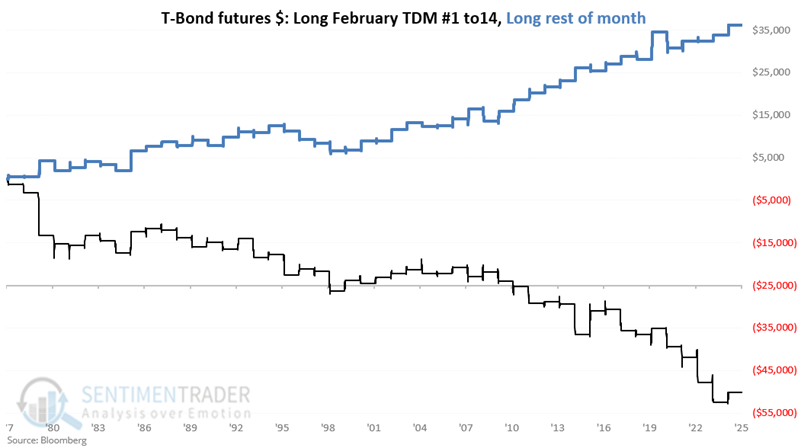
The chart below displays the cumulative hypothetical result achieved by holding a long 1-lot position in t-bond futures ONLY during the 1st 14 trading days of every February starting in 1978.
Not a pretty picture. Now let's look at the rest of the month.
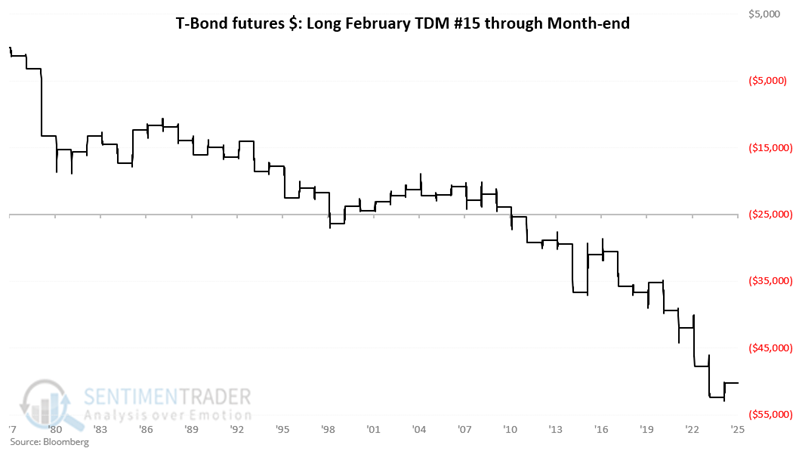
The chart below displays the cumulative hypothetical result achieved by holding a long 1-lot position in t-bond futures ONLY from trading day #15 through the end of February, starting in 1978.
The stark contrast in performance between the two parts of February is apparent when we combine the two charts above in the chart below.
To make things more interesting, let's consider the following "strategy" (such as it is):
- February Trading Days #1 through 14 = Short 1-lot of t-bond futures
- February Trading Days #15+ = Long 1-lot of t-bond futures
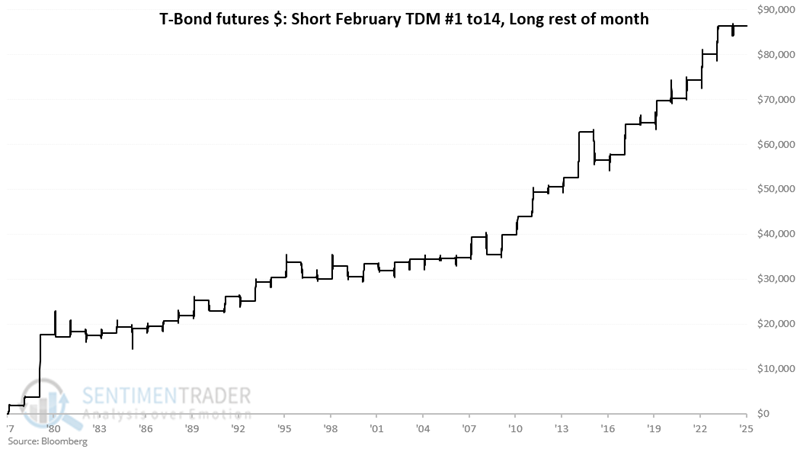
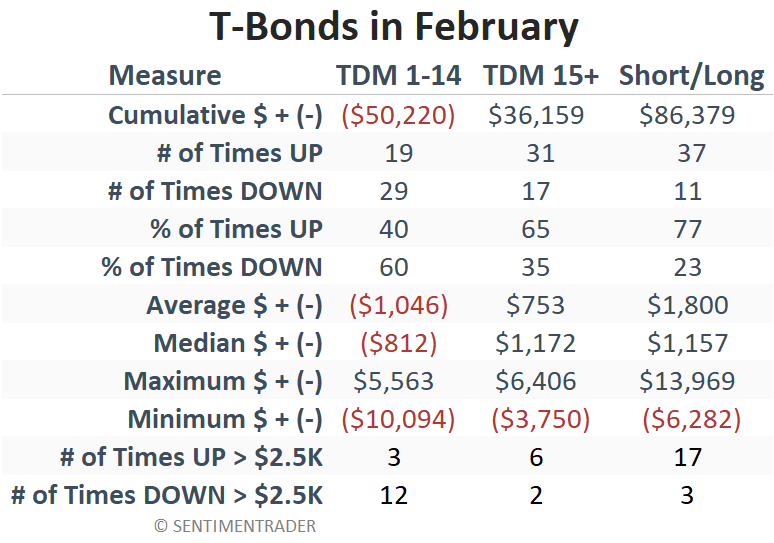
The table below summarizes the results.
The current status
For 2026:
- The "Unfavorable" first fourteen trading days of February 2026 encompass February 2nd through February 20
- The "Favorable" period for February this year encompasses February 23rd through the 27th
So, a t-bond futures trader would hold a short position in t-bond futures through February 20th and then switch to a long position after that through the end of the month.
For non-futures traders, alternatives to T-bond futures include the ETFs TLT (iShares 20+ Year Treasury Bond), TMF (Direxion Daily 20+ Year Treasury Bull 3X Shares), and TMV (Direxion Daily 20+ Year Treasury Bear 3X Shares). Note that trading tickers TMF and/or TMV entails a significant degree of risk because they return three times the daily change in the price of t-bond futures.
What the research tells us…
As the data above shows, t-bonds have tended to weaken early in the month, followed by strength later in the month. The caveat is that results can and do vary widely from year to year. Traders considering employing these short-term tendencies should carefully assess position sizing and stop-loss levels to limit risk.