
Surveys say investors gave up...then hurried back

Key points:
- Newsletter writers are bearish on stocks, traditionally a good contrary indicator for investors
- Other surveys show a dramatic drop in sentiment, pushing the AIM Model to a reading of near-maximum bearishness
- Similar readings tended to precede multi-month relief rallies, a good sign for those watching post-correction behavior
- They may scramble more now as breadth surges
A big blip in bulls
Bulls are anxious about whether a correction in the world's most benchmarked equity index is going to morph into a bear market. So far, they should be encouraged.
The S&P 500 has rebounded well after falling -10% from its peak, and as long as it doesn't violate its low by much, bulls should continue to be encouraged. It should be further encouraging that the rebound may have significantly more to go since so many bulls already ran for the exits.
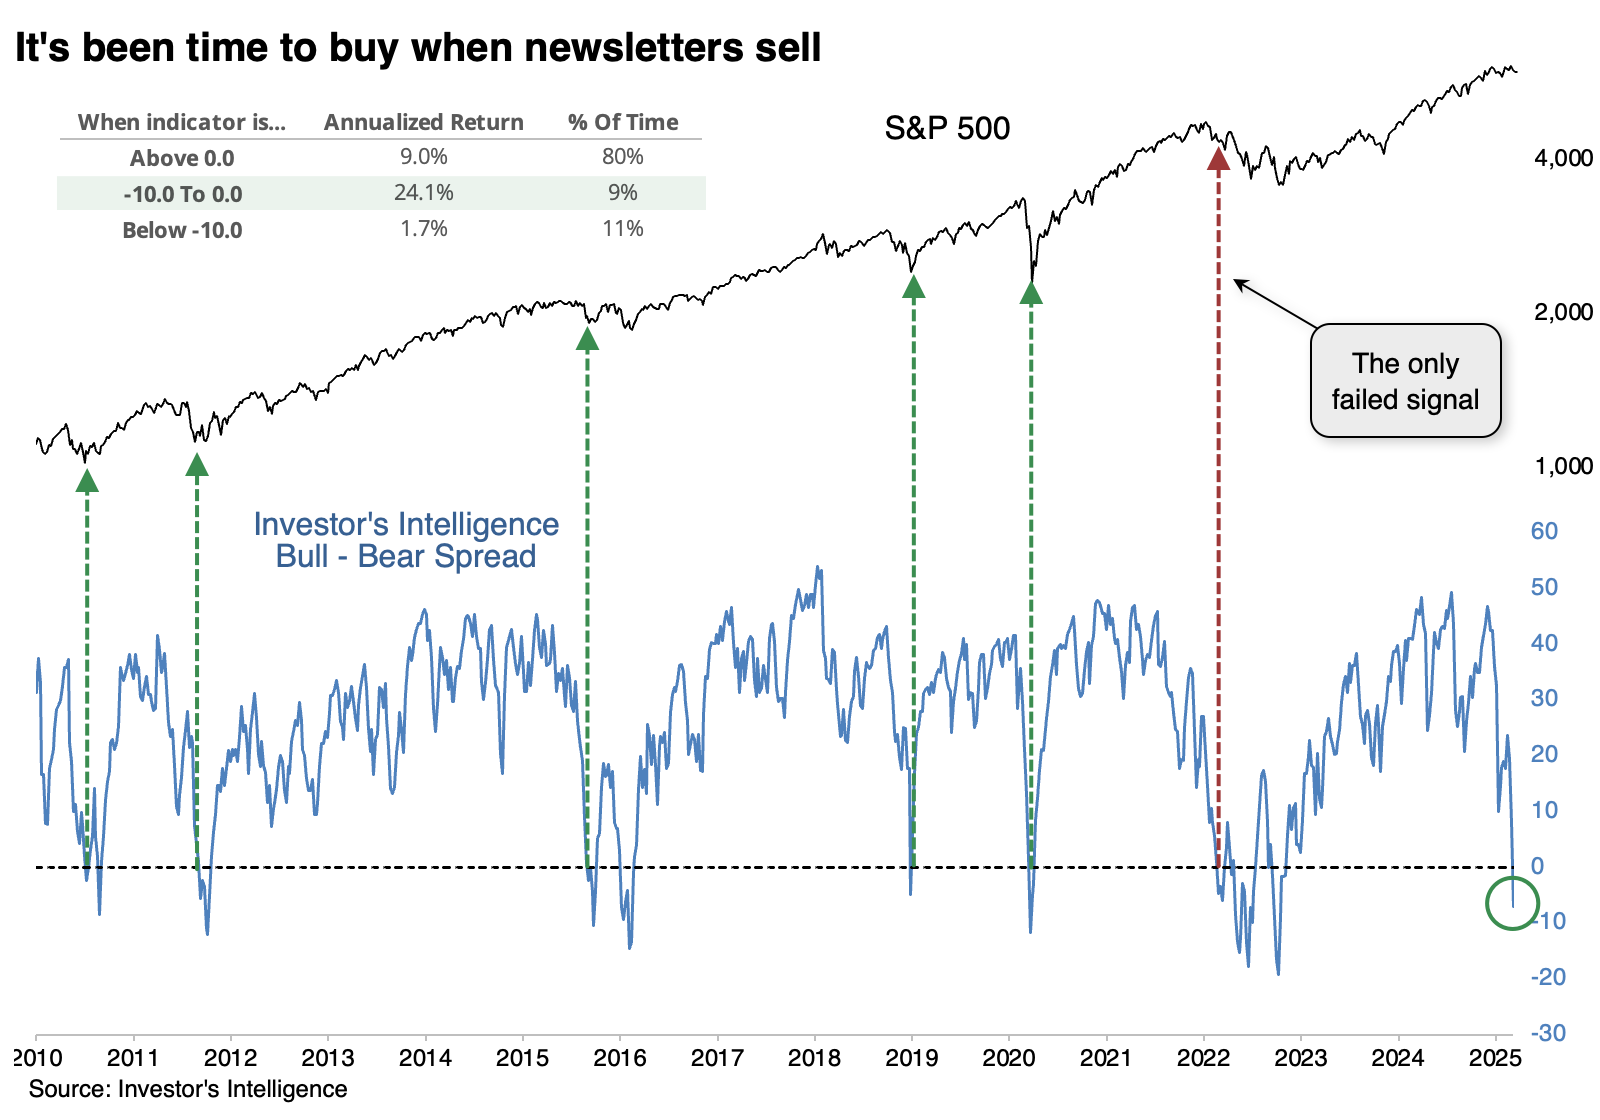
The granddaddy of sentiment surveys, Investor's Intelligence, noted last week that there were fewer bulls than bears among the newsletters they poll. We can see below that a negative bull-bear spread is unusual, and when the spread is mildly negative, the S&P's annualized return is an excellent +24.1%. That's because we typically get only mild net bearish readings during bull markets. If bears outnumber bulls by 10% or more, that's typically a bear market environment.
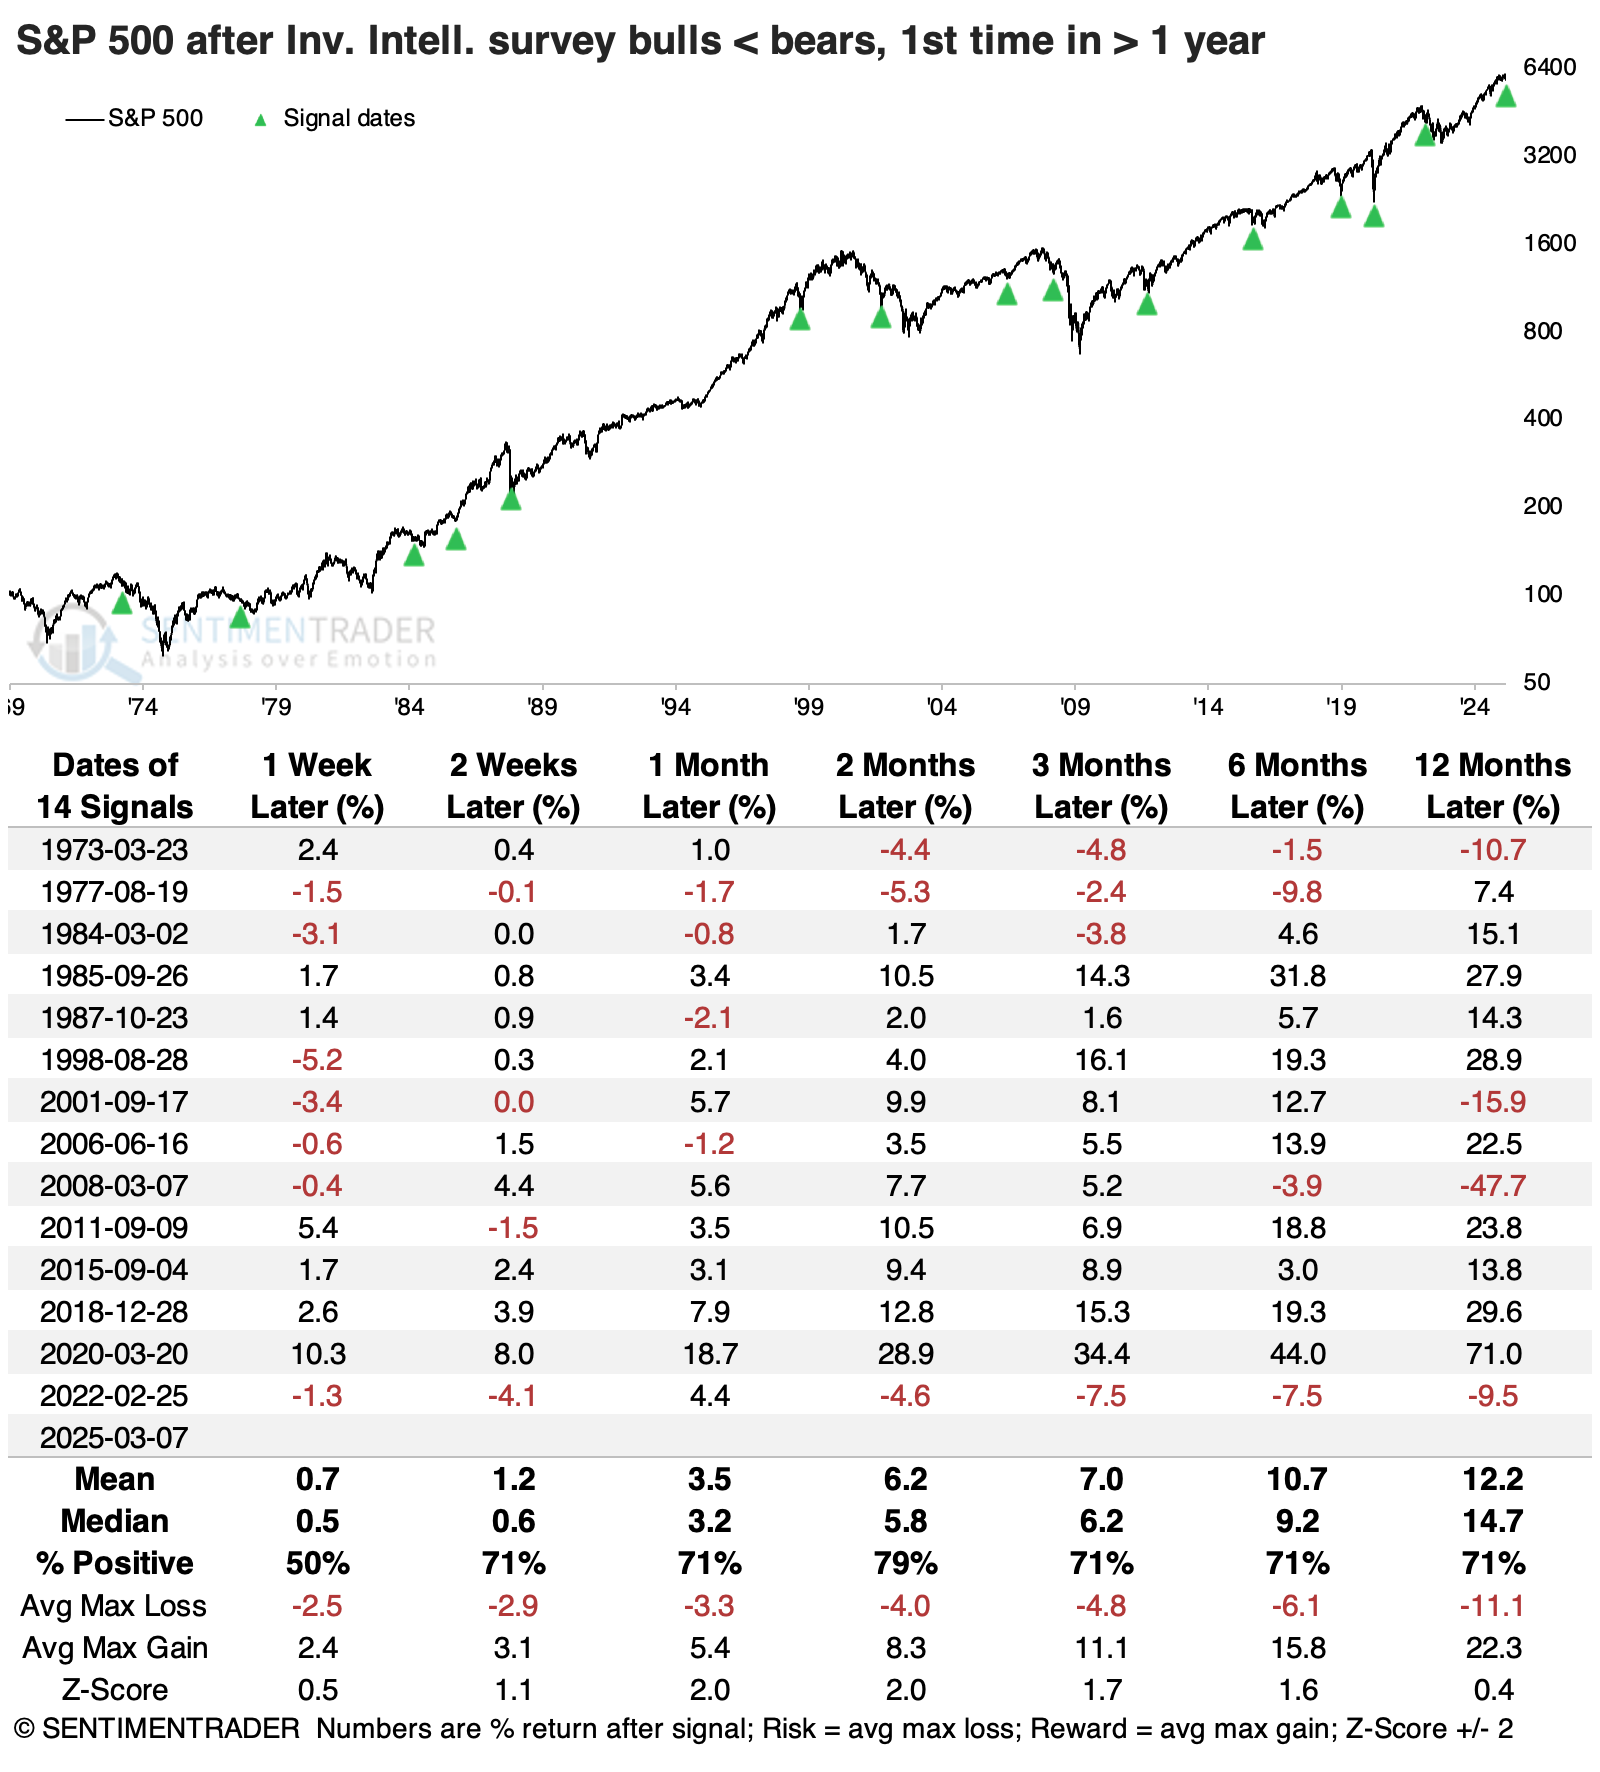
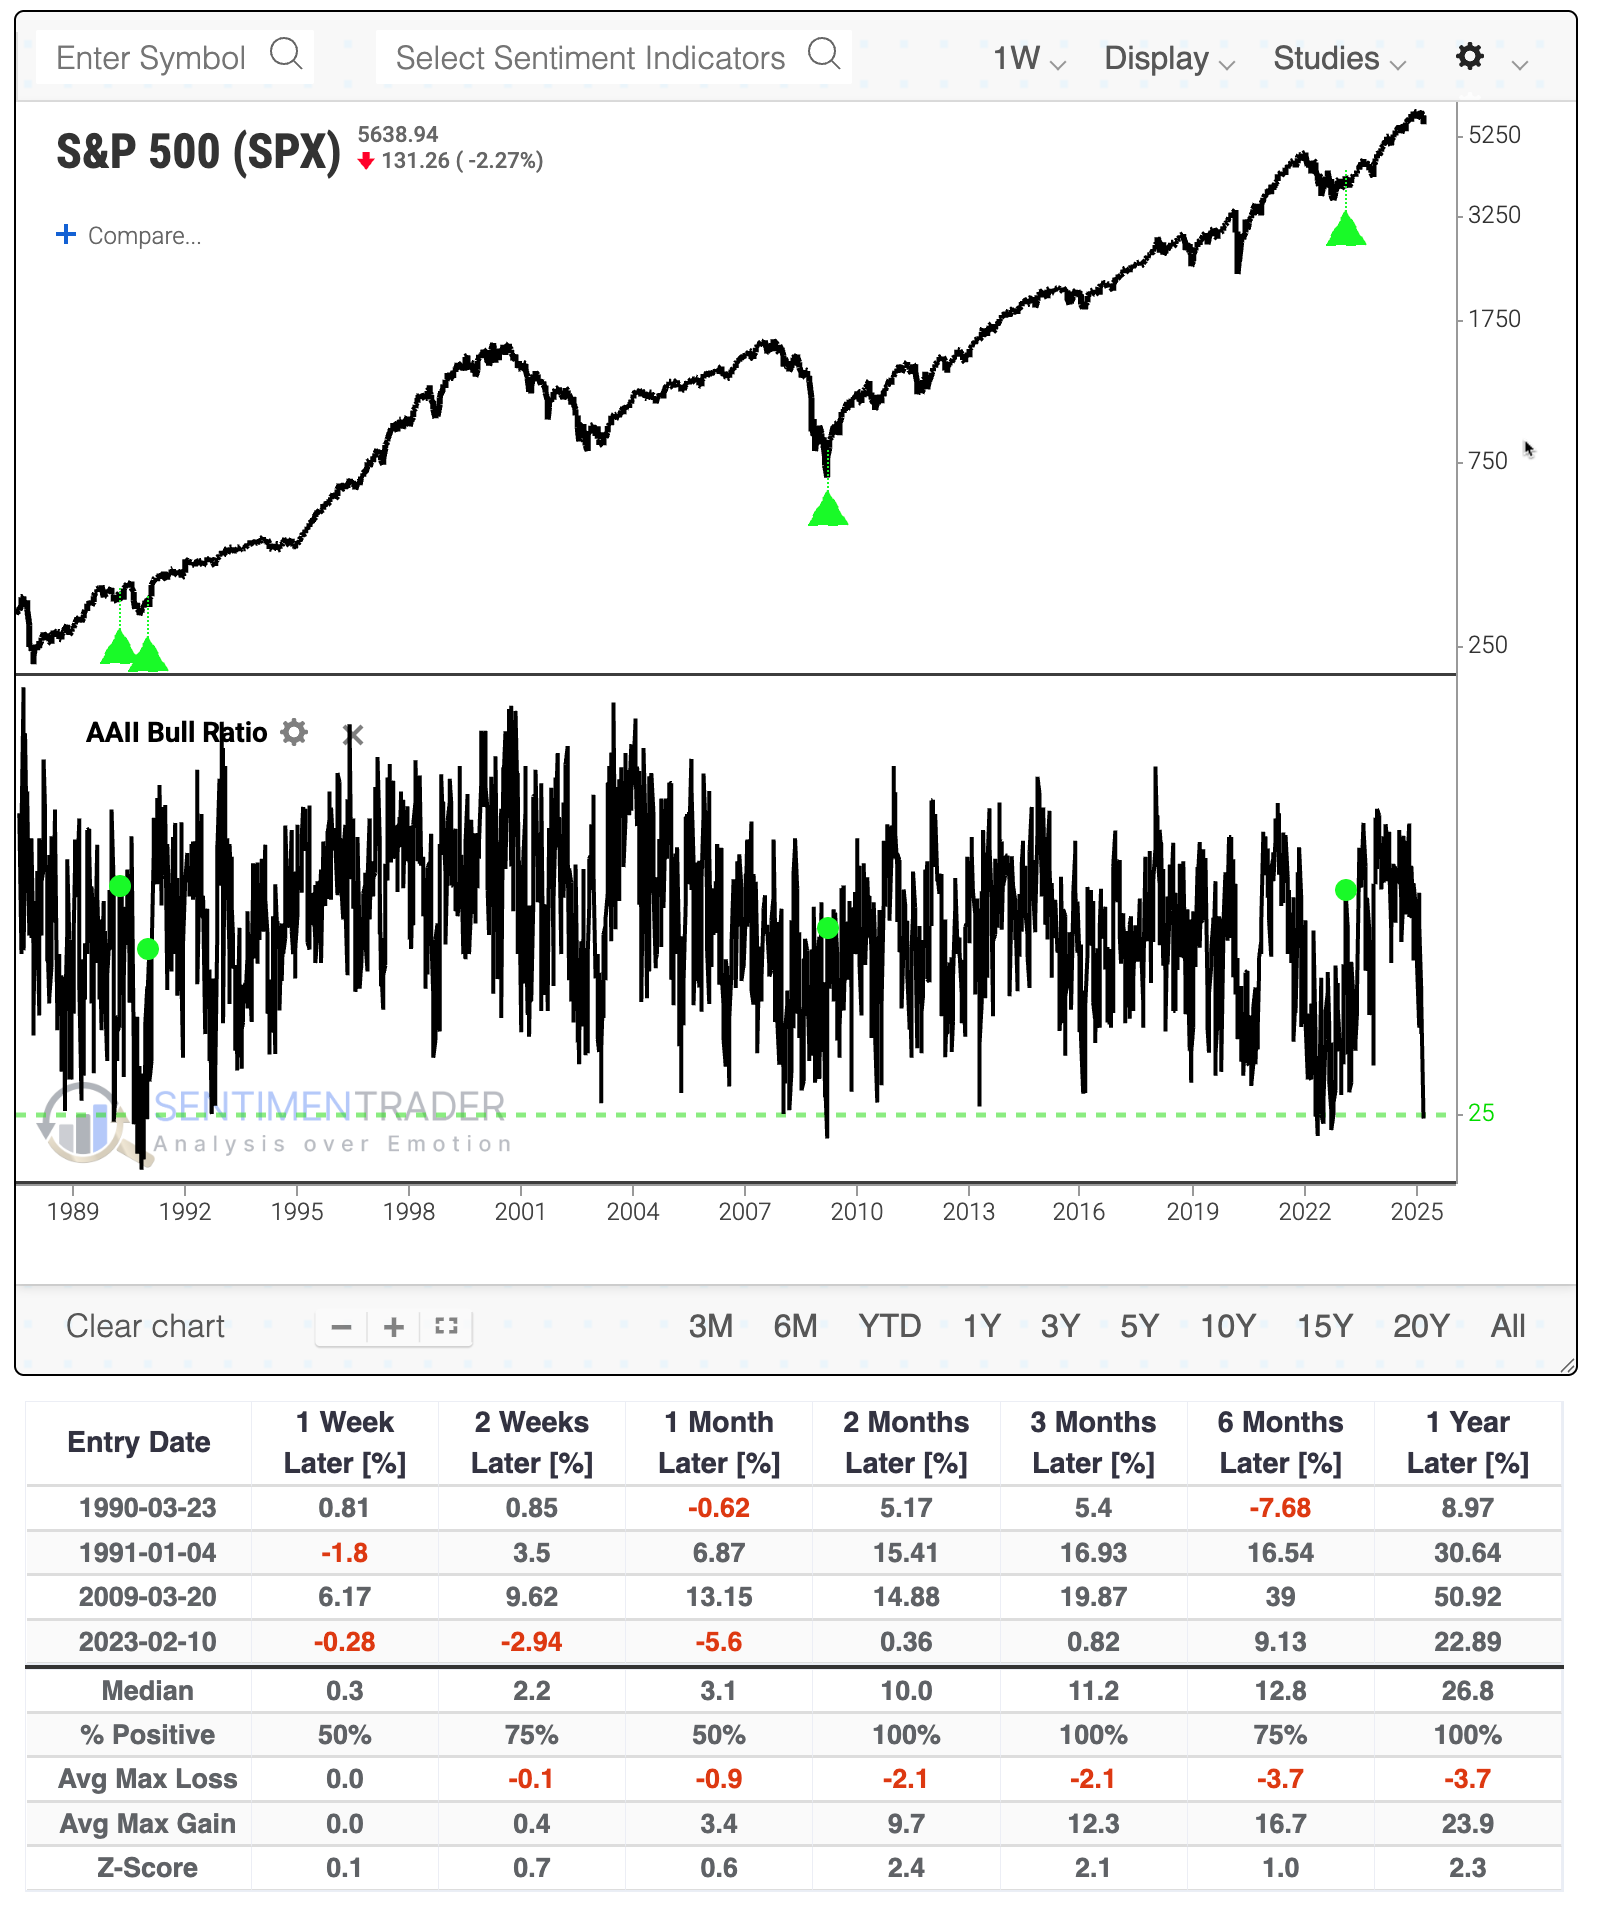
The table below shows how the S&P 500 fared after bears outnumbered bulls for the first time in at least a year. For the most part, these were good signs over the short- to intermediate-term. The S&P enjoyed a positive return either one or two months later after 13 of the 14 signals. Several of these then failed over the ensuing months, occurring relatively early in the bear markets of 1974, 2002, 2008, and 2022.
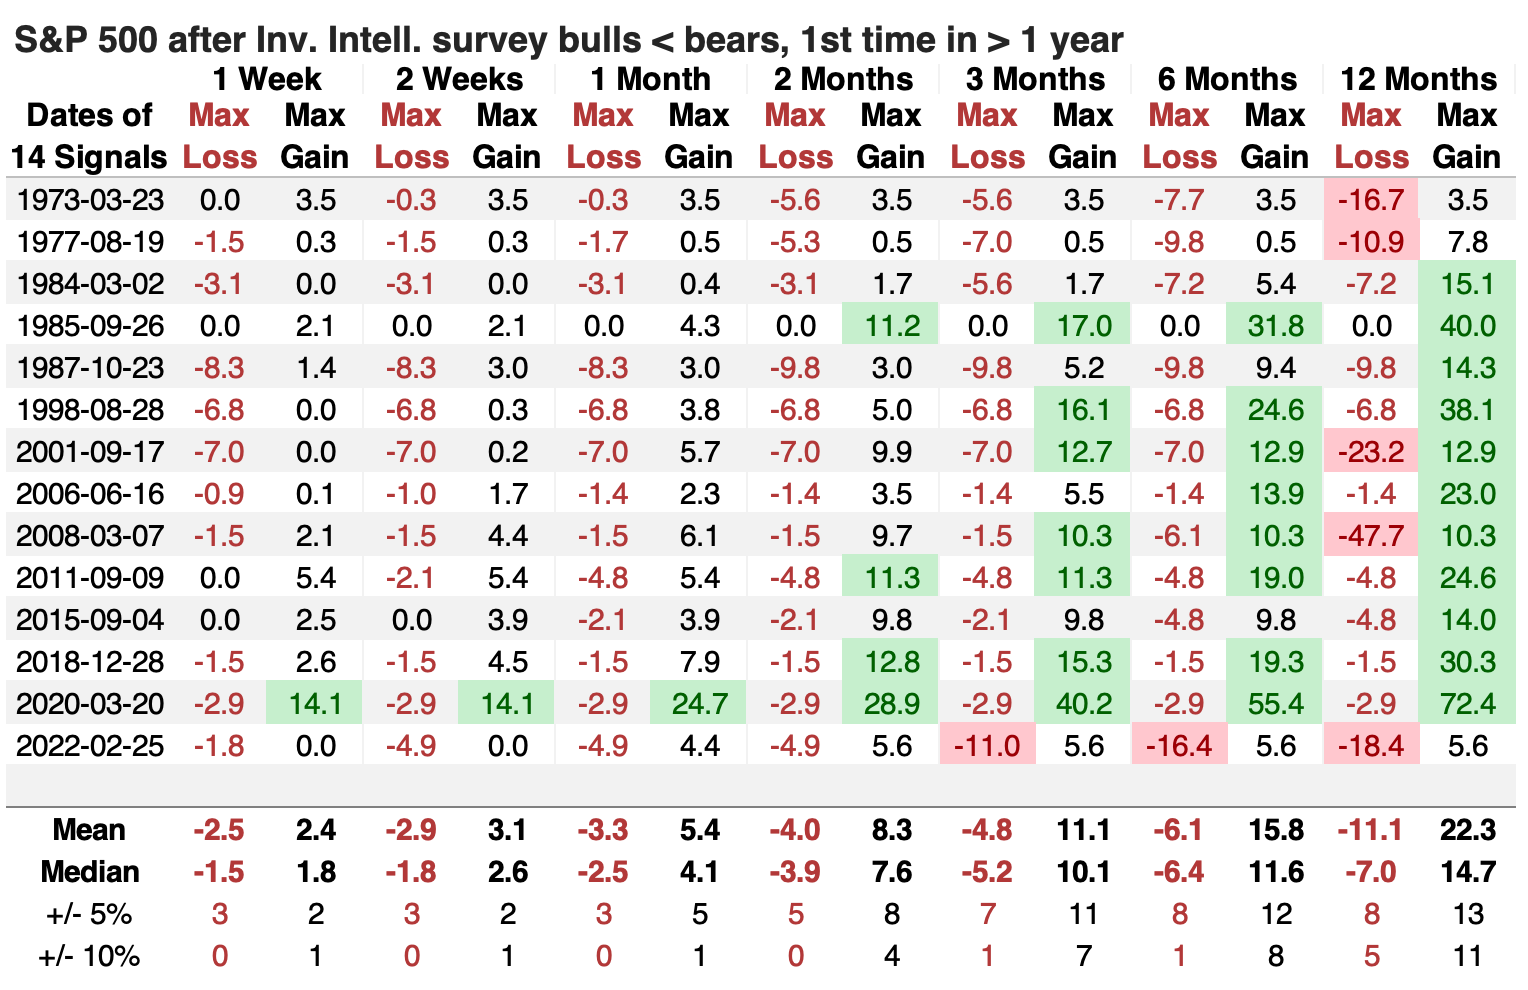
The table of maximum gains and losses across time frames shows that within the following six months, the S&P lost more than -10% only once (the last signal, in 2022) while gaining more than +10% eight times.
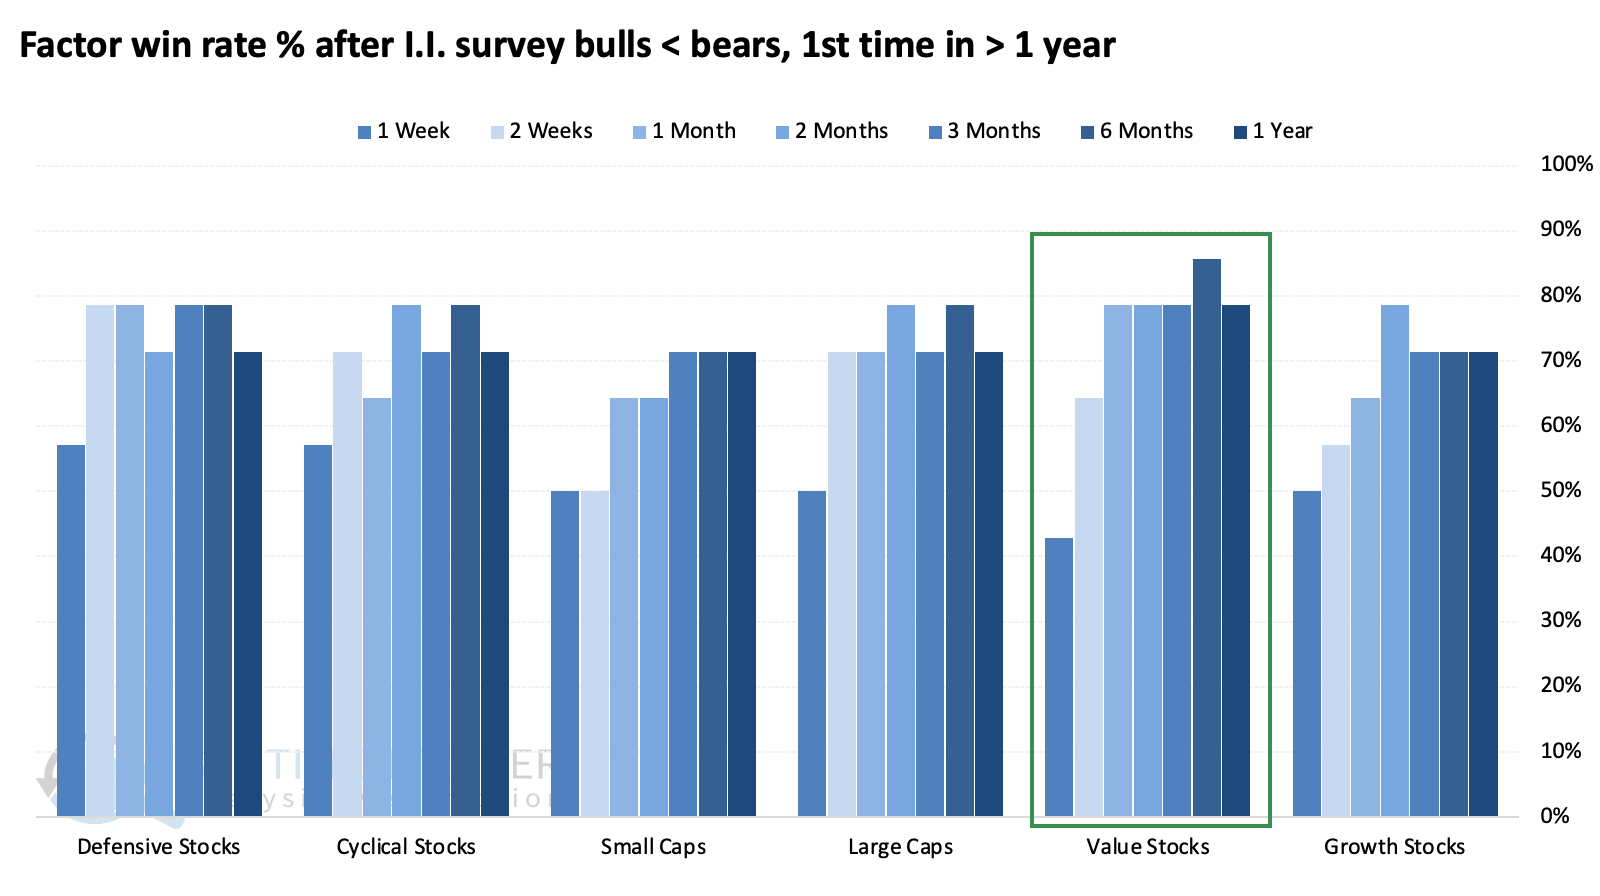
There wasn't too much differentiation among major S&P 500 sectors after the bull-bear spread turned negative, but among factors, value stocks stood out by having the highest average returns over the following six and twelve months...
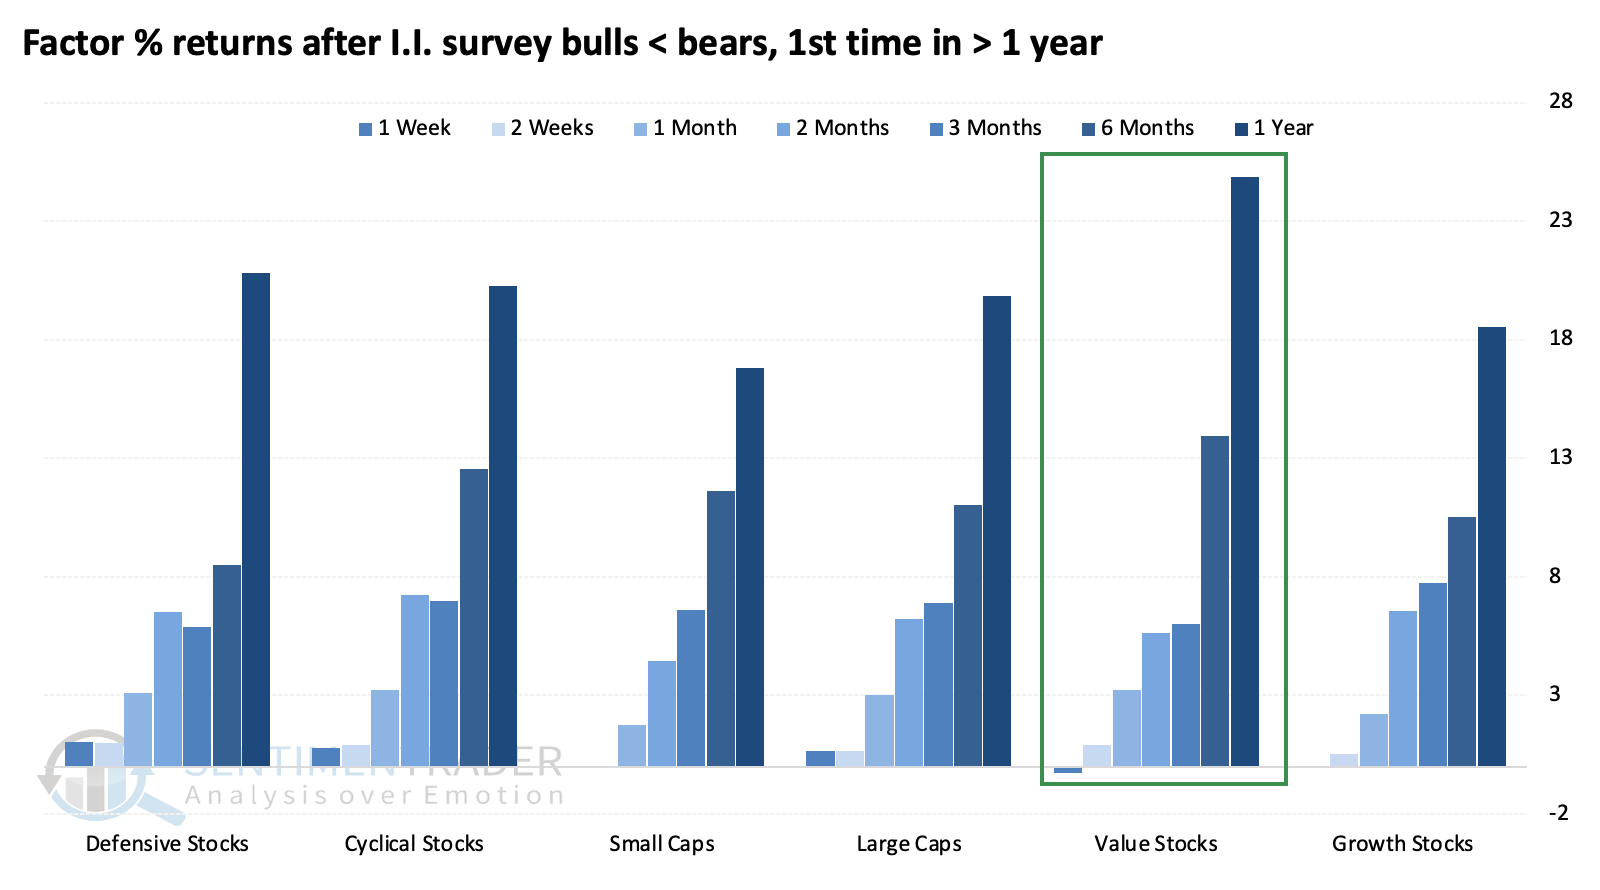
...while also enjoying the most consistent win rate.
Other surveys agree - investors are not bullish
Much has been made of the recently depressed state of sentiment among individual investors in the weekly survey from the American Association of Individual Investors (AAII).
The survey has numerous flaws, but for whatever reason is still quoted widely by legacy media. At most, we'd note that when the survey has become this skewed toward bearishness in the past, it has been best to wait for a recovery. When the Bull Ratio got back over 50%, it marked the end of three major bear markets.
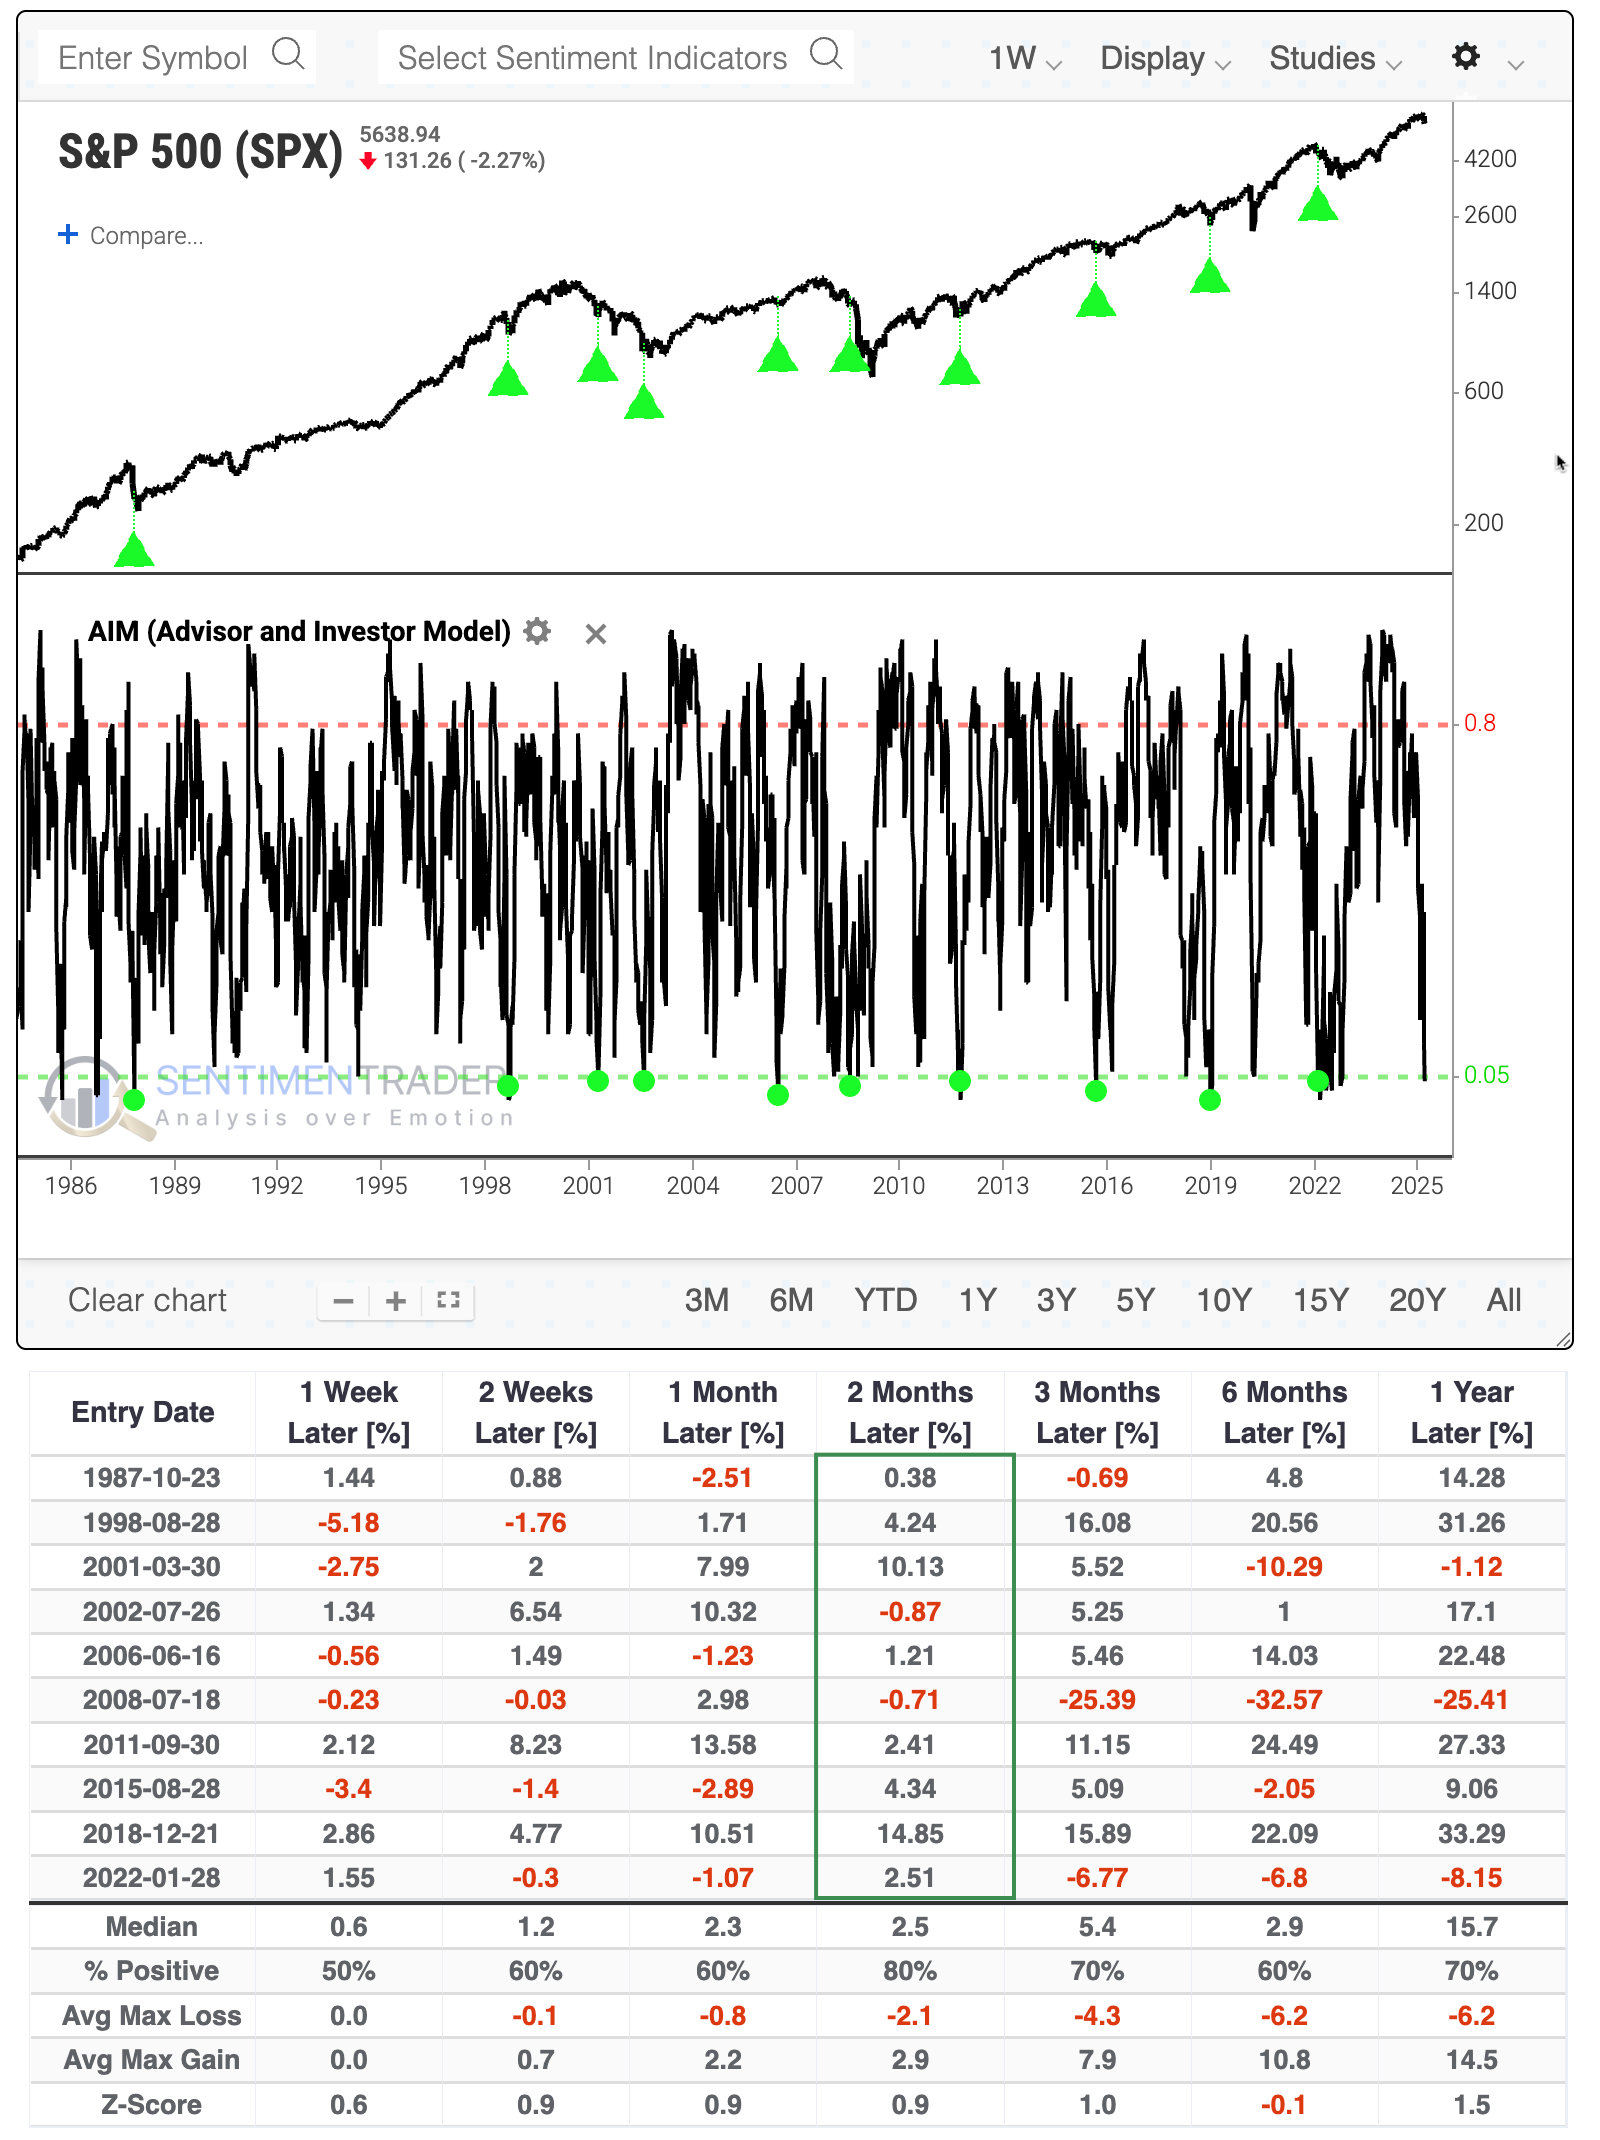
A handful of surveys go into the AIM Model, which has understandably cratered in recent weeks. The model had been showing that well more than 80% of investors were bullish, and that plunged to less than 5%.
According to Backtest Engine 2.0, that preceded decent rebounds in the S&P 500 over the next two months, with only two minuscule losses (click here to load the test, then click the Run Backtest button to execute it).
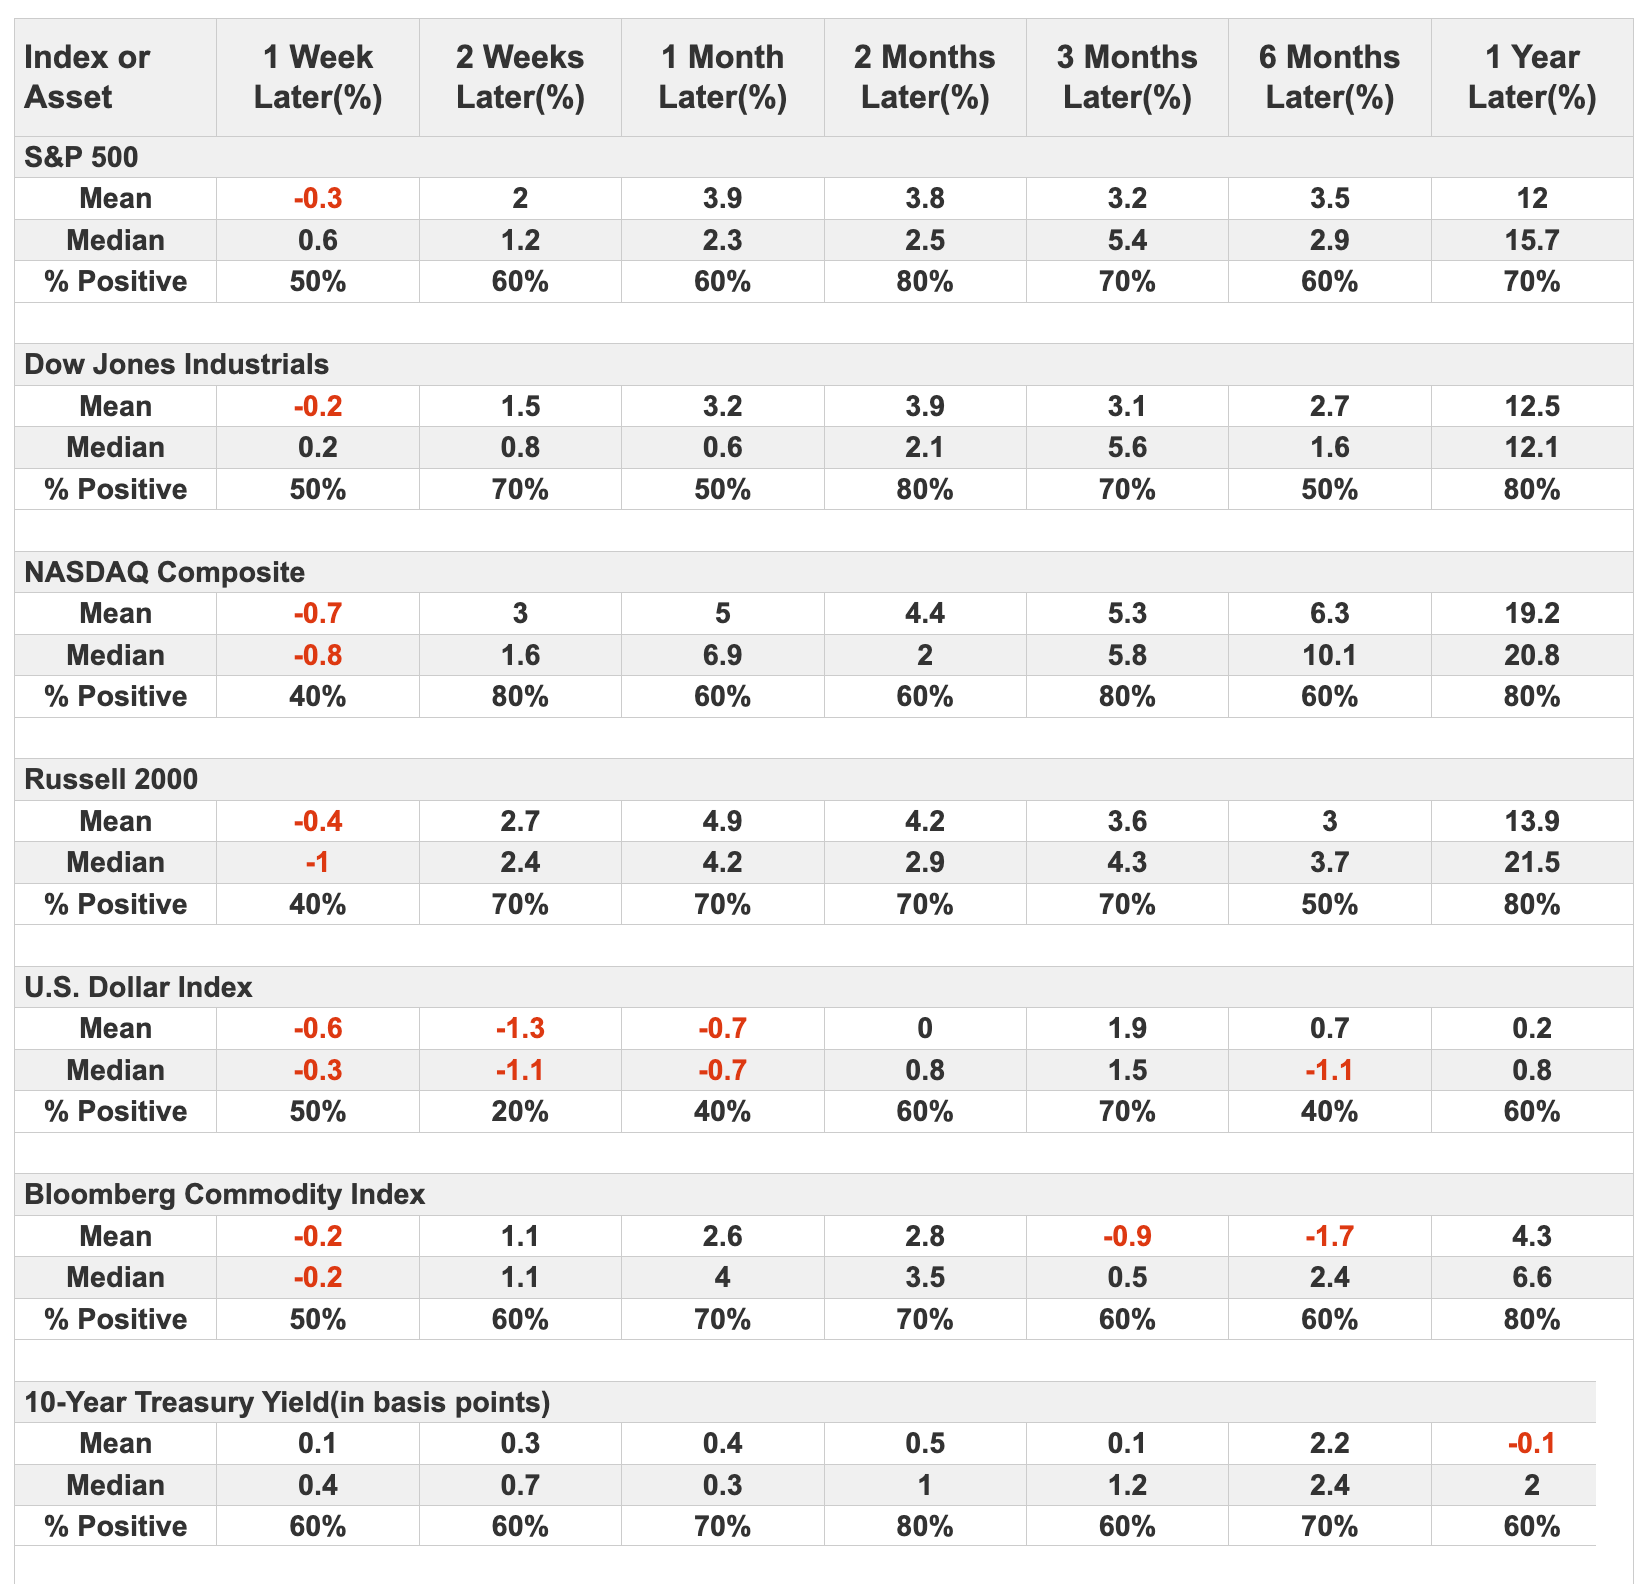
One of the handy new features the tech team has built in the results is a tab for Major Indexes. It allows you to see at a glance how other major equity indices and markets performed after these signals.
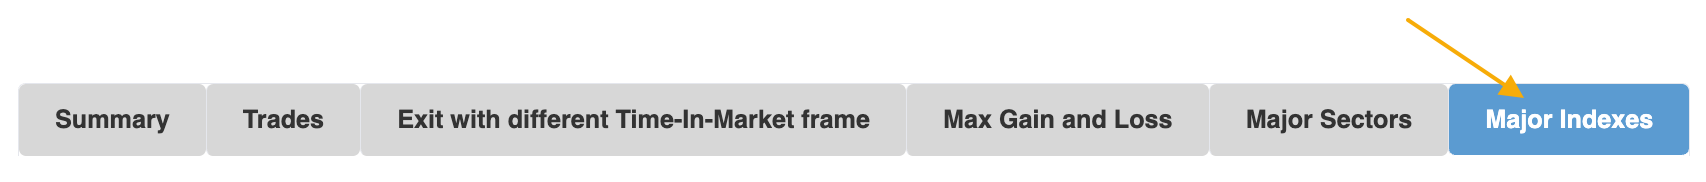
Clicking that tab shows us that the S&P 500 and Dow Industrials fared best over the short- to intermediate-term, with 80% win rates, while the Nasdaq Composite and Russell 2000 weren't as consistent.
They're already returning
By the time the smoke cleared on Tuesday, it appears that some of these investors have already started to scramble back.
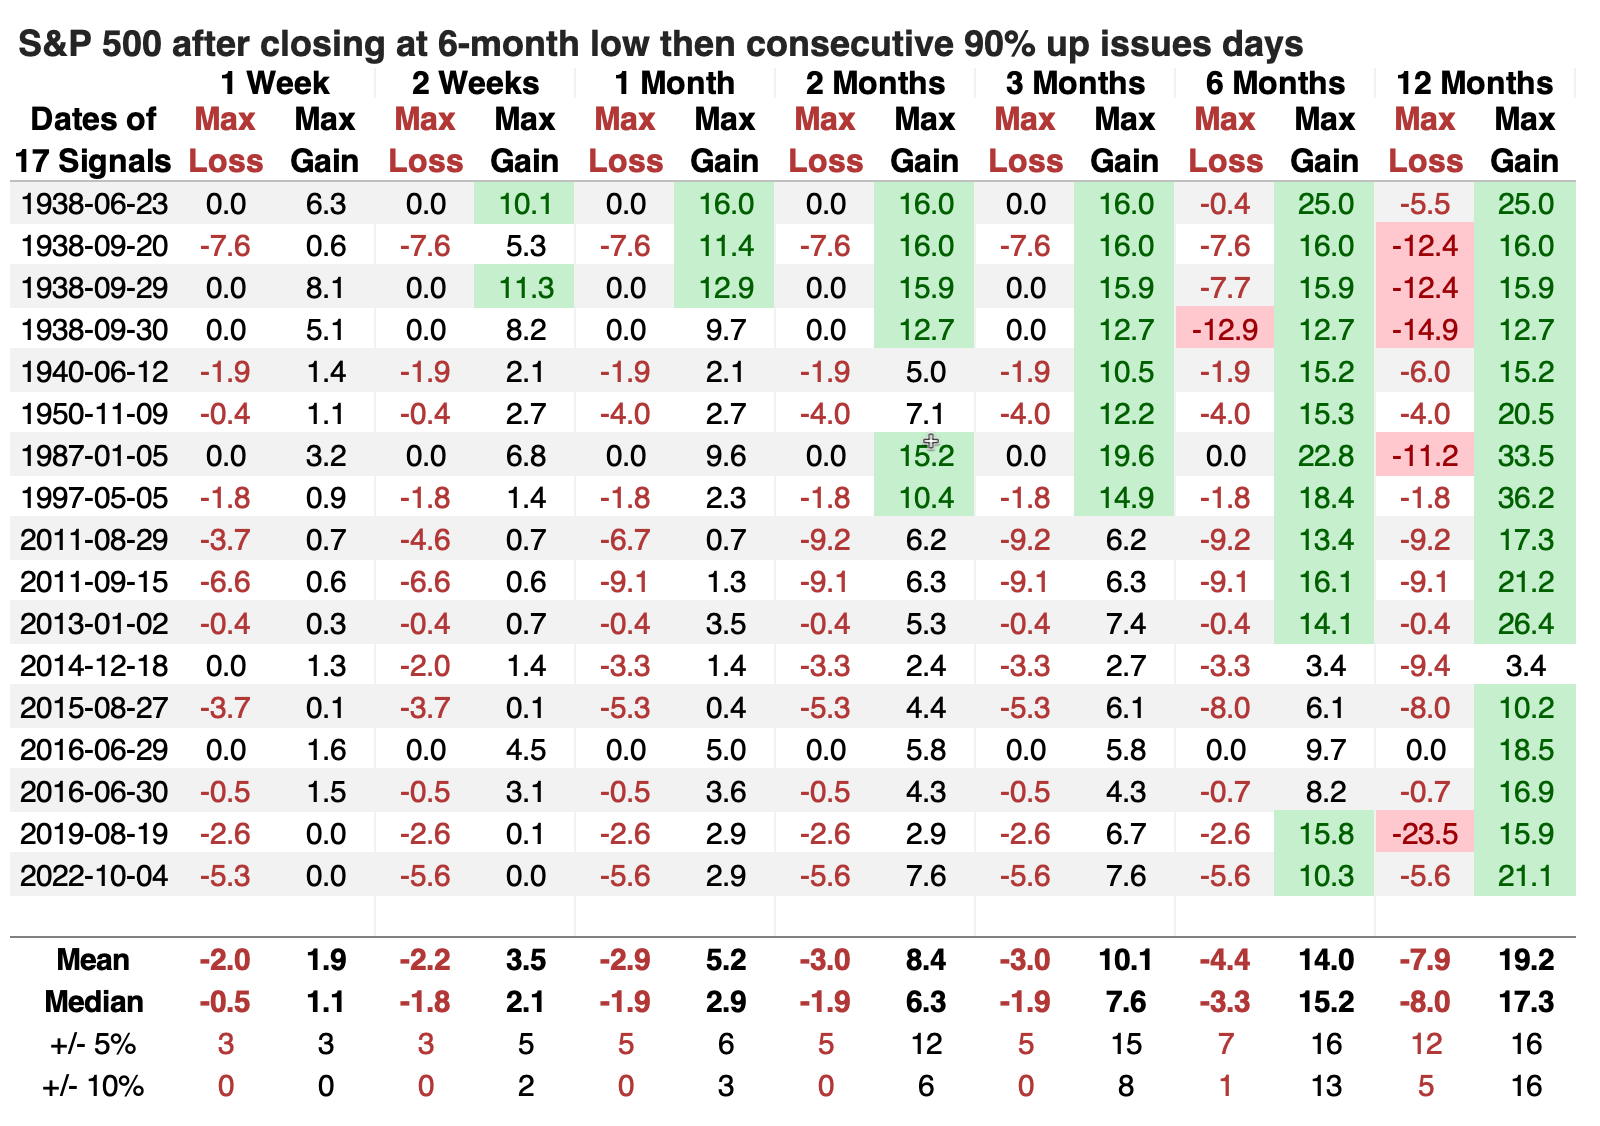
For the first time since the market bottomed in 2022, the S&P 500 set a six-month closing low, then enjoyed back-to-back days with more than 90% of its stocks advancing on the day. These patterns have often proved to be bear-killers in the past (at least temporarily), with the S&P rising 100% of the time over the next two months.
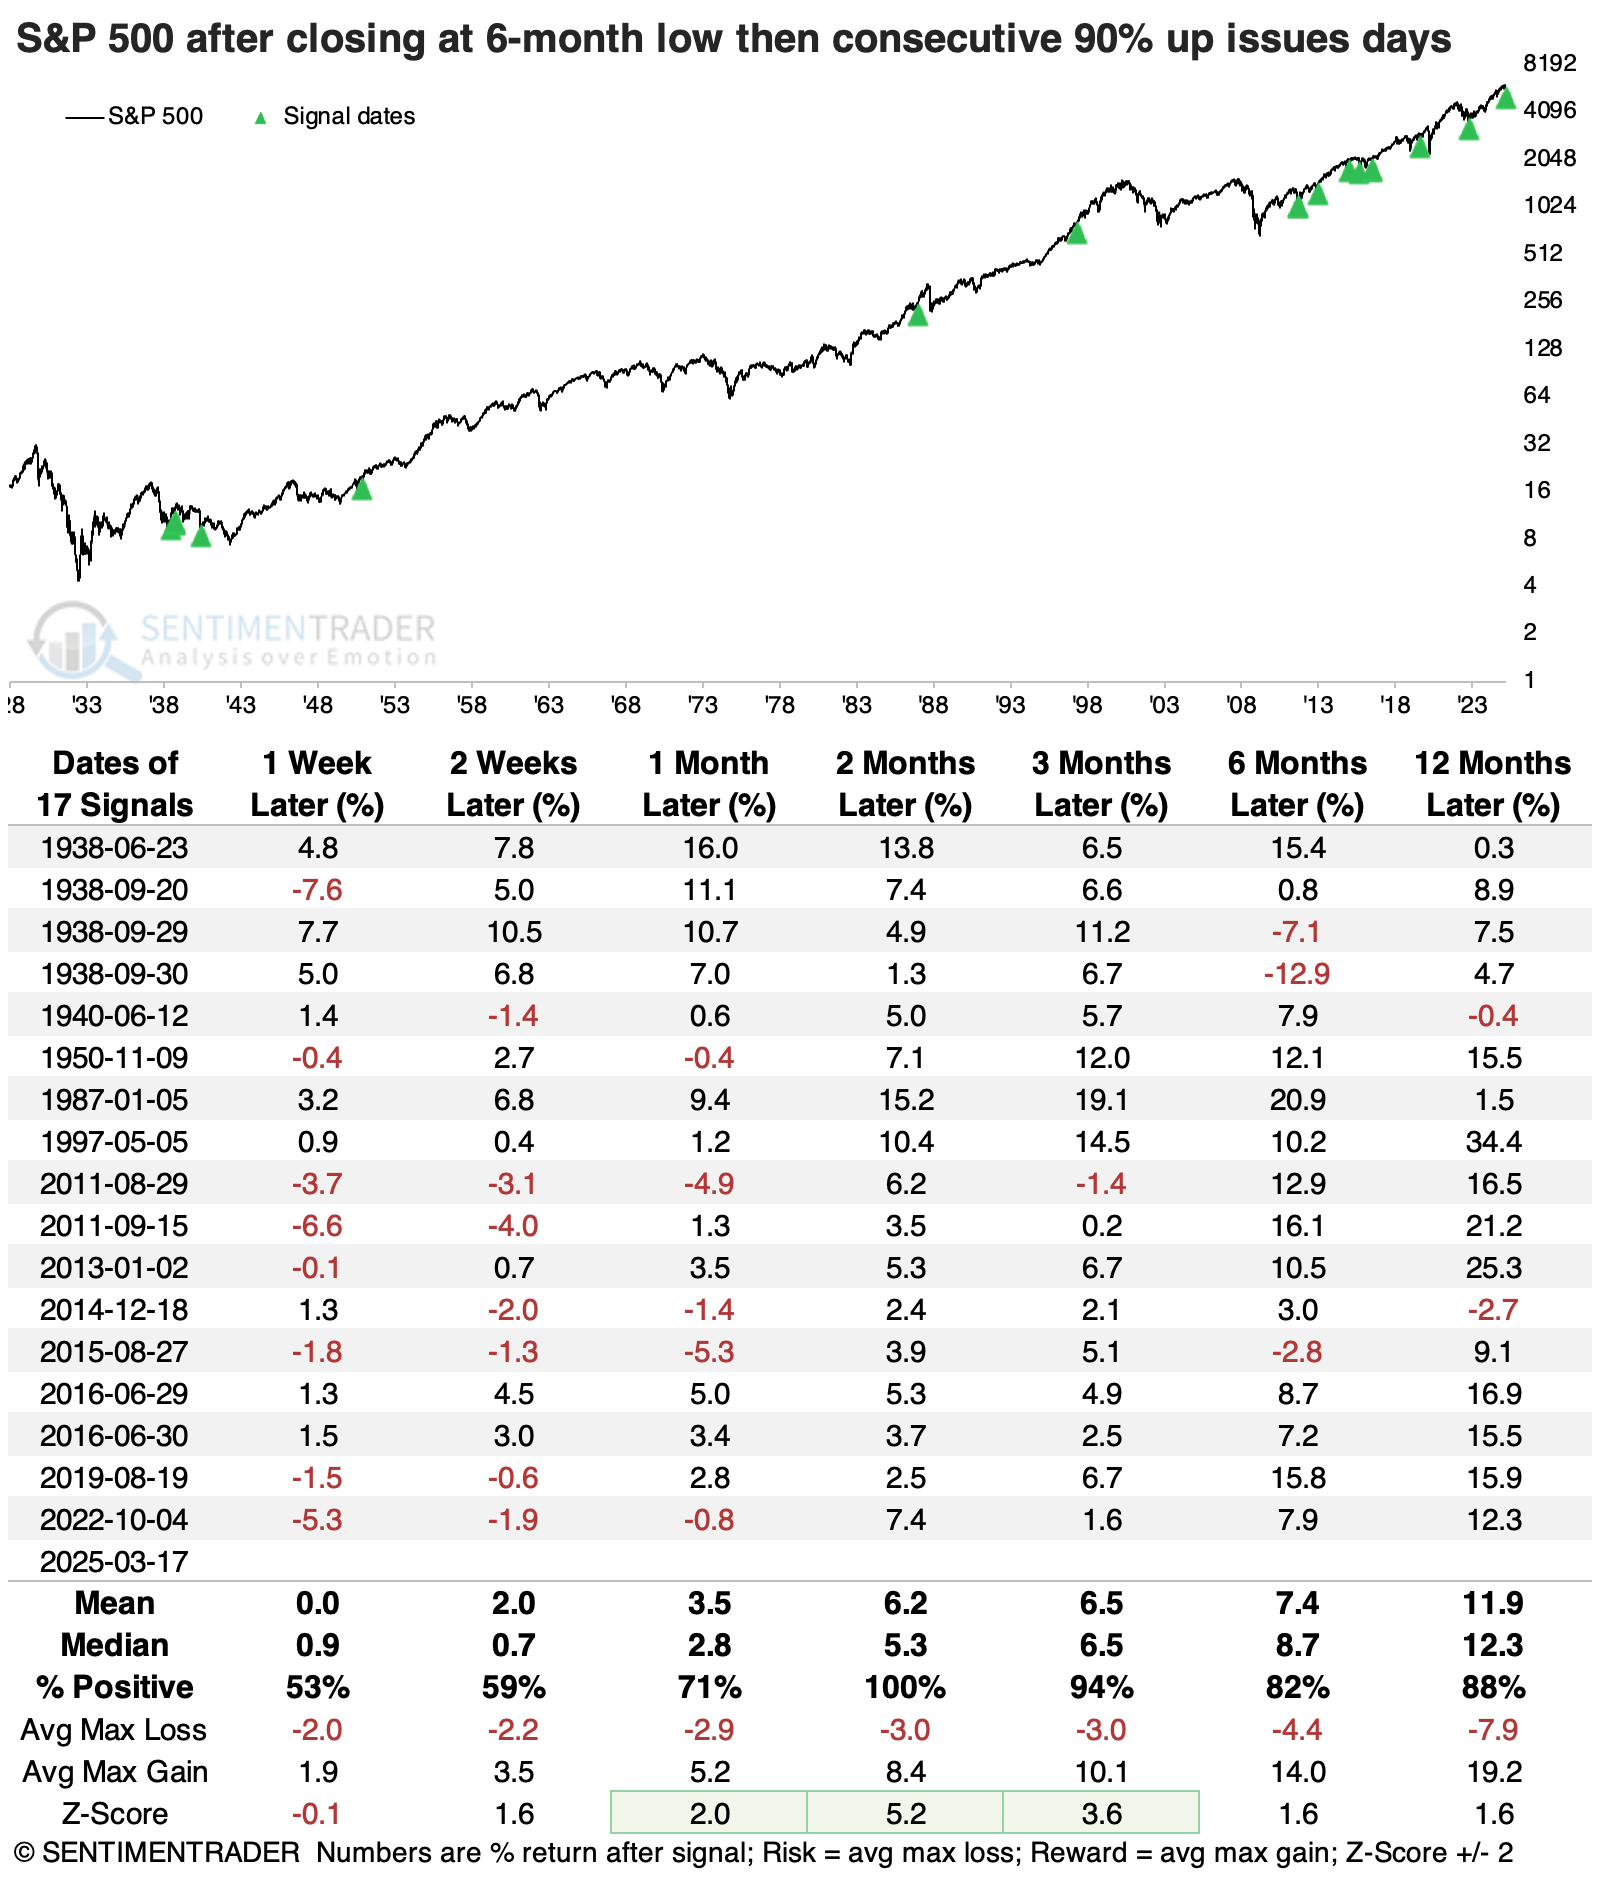
Within the next six months, the S&P suffered more than a -10% drawdown only once, way back in 1938. But it rallied more than +10% at some point thirteen times. Over shorter time frames, like three months, the S&P was three times more likely to see a +5% rally than a -5% decline.
What the research tells us...
According to the most widely available sentiment surveys, investors aren't enjoying the implementation of the new administration's geopolitical and economic policies. At least, that's what they're saying, and we should know by now that people don't always vote with their wallets. So, they may be saying they're bearish while still holding onto a lot of their positions.
Whether they've sold or not, by the time sentiment has gotten this poor, most of the losses have tended to be behind us, at least for a while. The next two to three months have generally been a time of regret for those newly minted bears, as stock indices had a consistent tendency to rebound, often strongly. The breadth thrust over the past two days is further confirmation. If it follows through again this time, it bodes well for the longer term, as we saw with the correction data. Going that long without a meaningful loss from the correction point has boded well for the months afterward, as well.