
Survey-based sentiment measures reversed from extreme pessimism

Key points:
- The Advisor and Investor Model recovered from one of the most pessimistic conditions in history
- Similar shifts in sentiment saw the S&P 500 rise 93% of the time over the next six and twelve months
- Cyclical sectors generally outperformed defensive groups across most time frames
A recovery in sentiment surveys bodes well for stocks
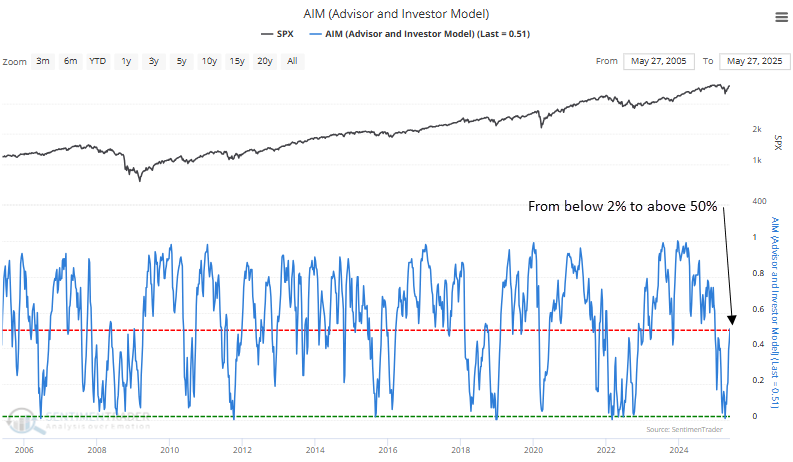
The Advisor and Investor Model, a sentiment composite that aggregates several widely followed surveys, fell to an extreme low of just 1% during the depths of the Liberation Day Meltdown. Such an extreme level of pessimism has occurred in less than 2% of instances since 1970.
Over the last six weeks, the model has staged a recovery, recently rising above 50%. This rebound suggests that the underlying survey constituents are shifting toward a more optimistic outlook. Historically, such a transition from extreme pessimism to growing optimism tends to coincide with renewed upside momentum in stock prices, as improving sentiment supports increased risk appetite.
The previous signal occurred in November 2022, resulting in robust gains over the subsequent year.
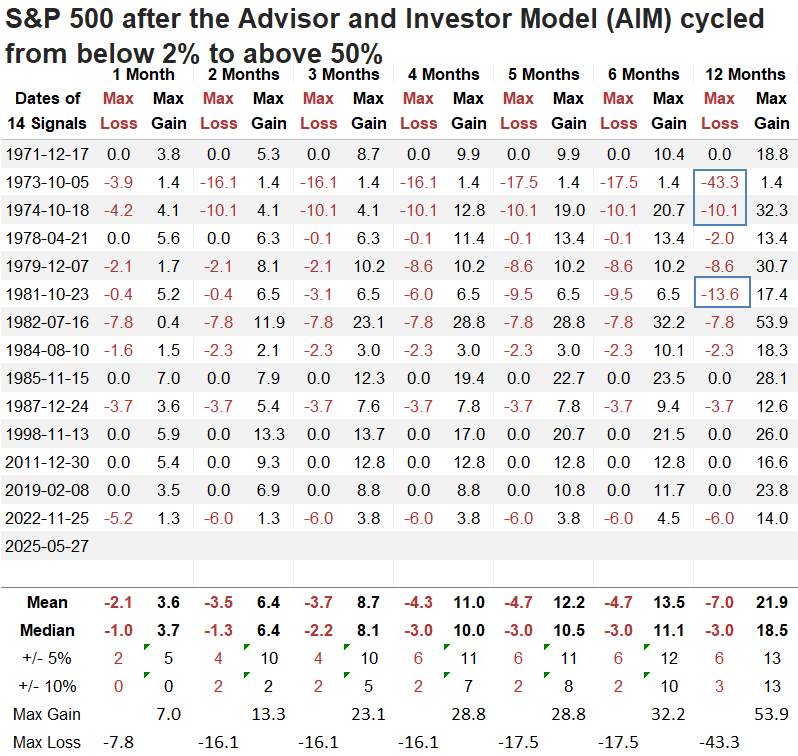
Comparable reversals in sentiment preceded a favorable outlook for stocks
Each time the Advisor and Investor Model transitioned from below 2% to above 50%, it often marked a shift in sentiment that aligned with rising risk appetite, supporting further gains in stocks over longer timeframes. In all but one instance, the S&P 500 was higher six and twelve months later.
Despite the robust long-term outlook, it's essential to recognize that similar setups occurred during bear market rallies in 1973 and again in 1981.
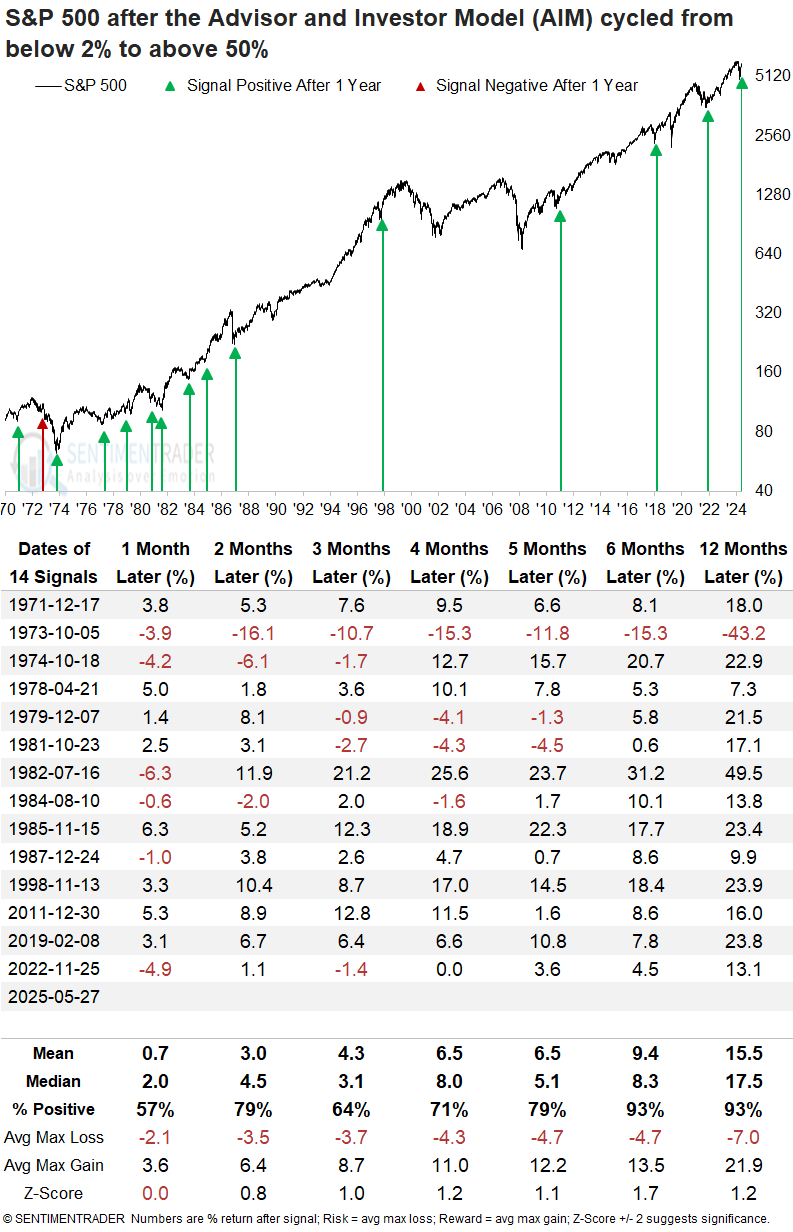
A year later, the S&P 500 declined more than 10% only three times. In contrast, it posted rallies of over 10% in 13 cases, suggesting a favorable risk/reward scenario.
Technology and consumer discretionary were the top-performing sectors one year later, each outperforming the S&P 500 in six of the seven intervals.
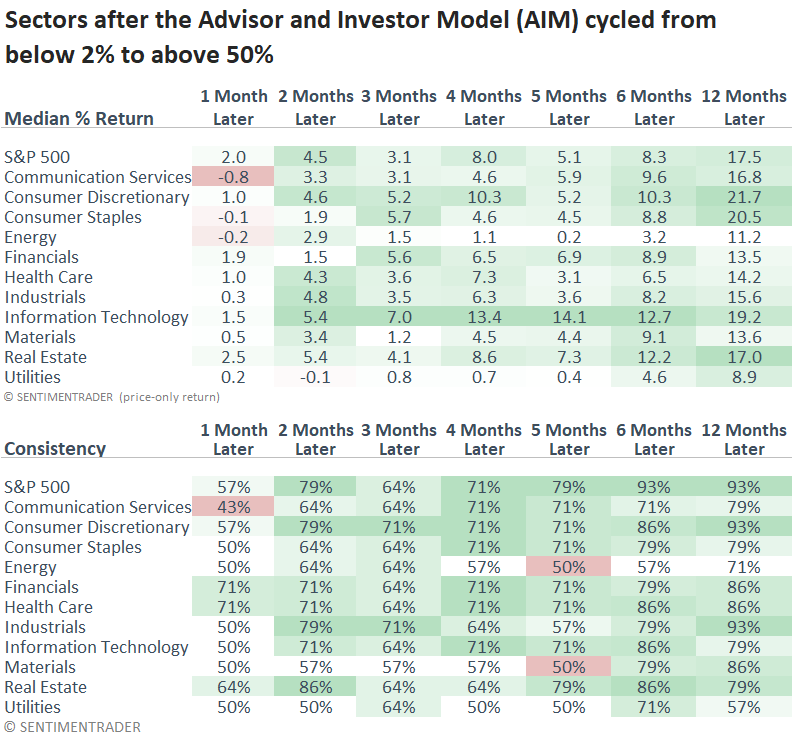
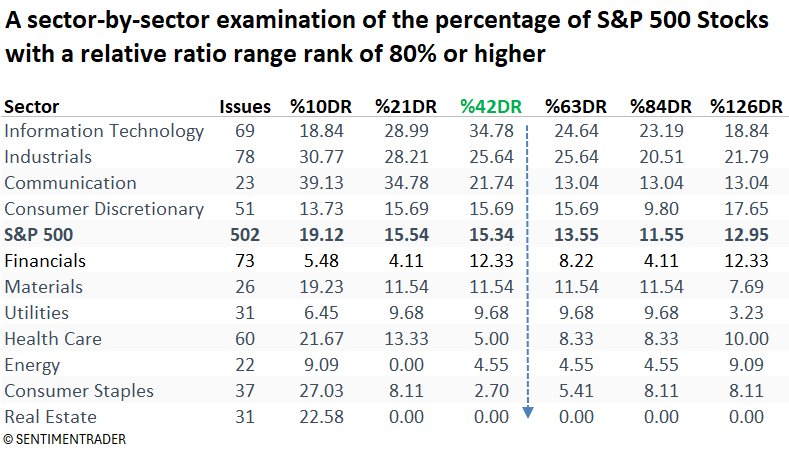
Cyclicals continue to display the highest relative ratio ranks
As always, it's critical to assess how historical tendencies align with current market conditions. Using our relative range rank data for S&P 500 stocks found on the website's trend score page, I summarized which sectors had the highest proportion of stocks with a rank of 80% or higher across multiple durations.
The table below shows that offensive sectors, such as technology, industrials, communication services, and consumer discretionary, hold the largest share of stocks, with relative ratios hovering near the upper end of their ranges, indicating relative strength.
What does the weight of the evidence suggest?
Given the substantial rally from the lows and the wave of risk-on signals it triggered, another surge in bullish reports is unlikely in the near term, as stocks are in some form of consolidation. With the early July tariff deadline approaching, the market may remain subdued for now, even in the face of a bullish long-term outlook based on the positive skew in reports.
What the research tells us...
A composite gauge that aggregates sentiment-based surveys has recently rebounded from an extreme pessimistic condition, marking a notable shift in investor psychology. Similar recoveries from deeply negative sentiment have preceded strong and consistent long-term gains in the S&P 500. When investors reach a consensus level of fear or despair, it often coincides with market bottoms, creating a contrarian opportunity. As this sentiment composite moves out of extreme pessimism, it reflects a transition from capitulation to cautious optimism, a pattern that has reliably signaled durable rallies in past cycles.
Although the long-term outlook remains constructive due to numerous bullish signals, stocks appear to be consolidating recent gains, a pattern that may persist until the tariff deadline in July. Considering this potential scenario, it may be prudent for traders to exercise patience in the short term.