
Surprising Signals from Put/Call Ratios

Key points:
- It is rarely wise to rely on any one indicator to make buy and sell decisions; However, any one indicator can offer beneficial information
- Aggregated Put/Call Ratios for several indexes spiked recently
- These spikes suggest a surprising amount of skittishness on the part of traders - and in the process offers a bullish weight of the evidence
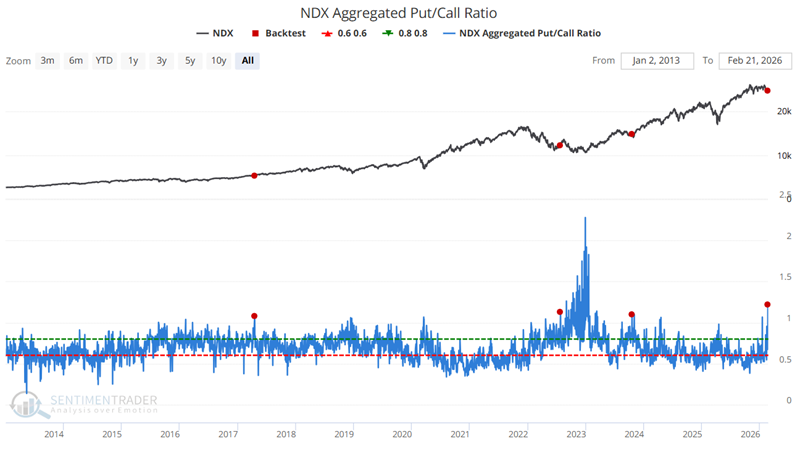
Sector #1: The Nasdaq 100 Index (NDX)
Much has been written about the apparent loss of momentum by the Nasdaq 100 Index in recent months (the index has gained no new ground since early October 2025), both on an absolute and relative basis compared to other indexes. So, is this once high-flyer about to lapse into a downtrend - and in the process, drag the overall market down with it?
Anything is possible. However, the recent spike in the NDX Aggregated Put/Call Ratio argues the contrary. The chart below highlights only those dates when the indicator crossed above 1.07 for the first time in 12 months. The most recent signal occurred on February 19th.
The table below summarizes subsequent NDX performance.
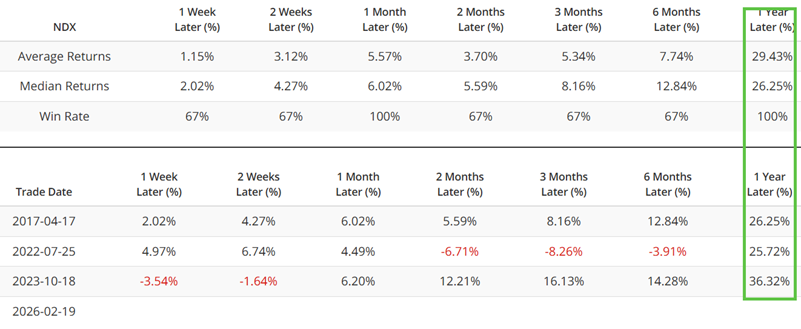
One problem is the minuscule sample size, which makes it dangerous to draw conclusions. Nevertheless, remember that we are not touting this as an outright "buy signal" but merely as a somewhat surprising contrarian bullish alert.
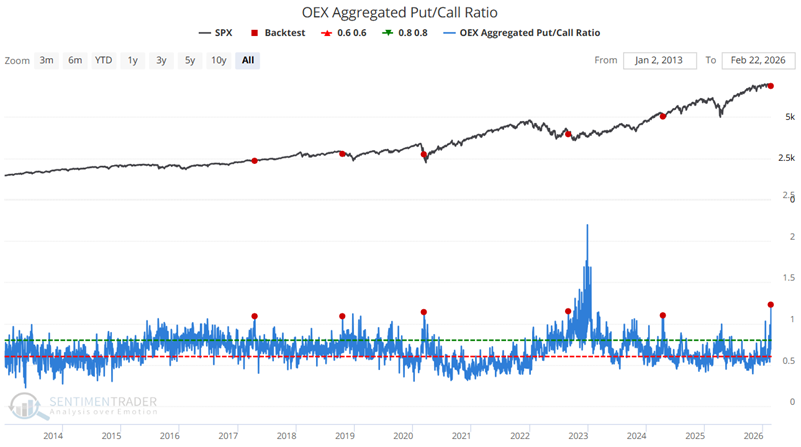
Sector #2: S&P 100 Index (OEX)
The S&P 100 Index contains the 100 largest capitalization-weighted stocks in the S&P 500 Index. The chart below highlights only those dates when the indicator crossed above 1.10 for the first time in 12 months. The most recent signal occurred on February 19th.
The table below summarizes subsequent S&P 500 Index performance.
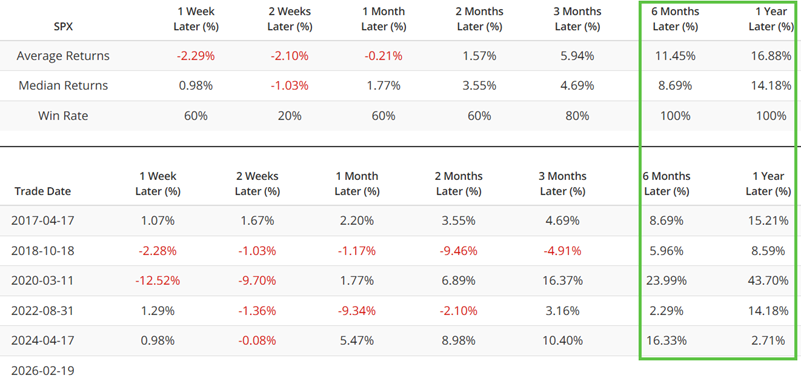
The same "impressive results BUT small sample size" caveats apply here.
Sector #3: Consumer Discretionary (XLY)
The State Street Consumer Discretionary Select Sector SPDR ETF (XLY) tracks the consumer discretionary sector. The chart below highlights only those dates when the XLY Aggregated Put/Call Ratio crossed above 1.15 for the first time in 12 months. The most recent signal occurred on February 19th.
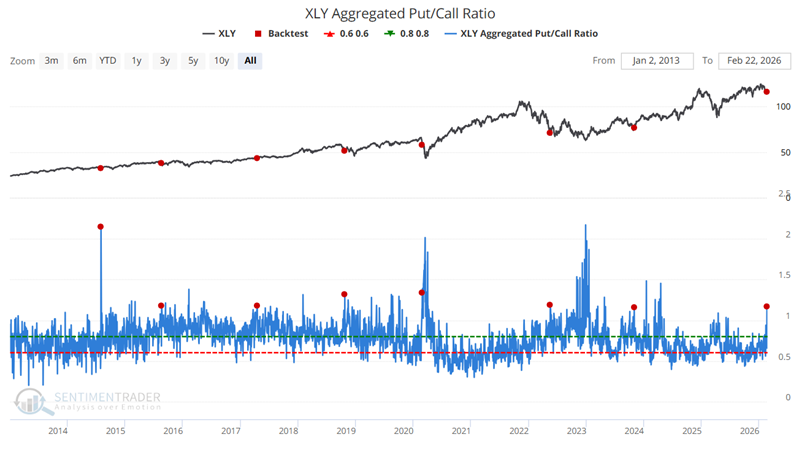
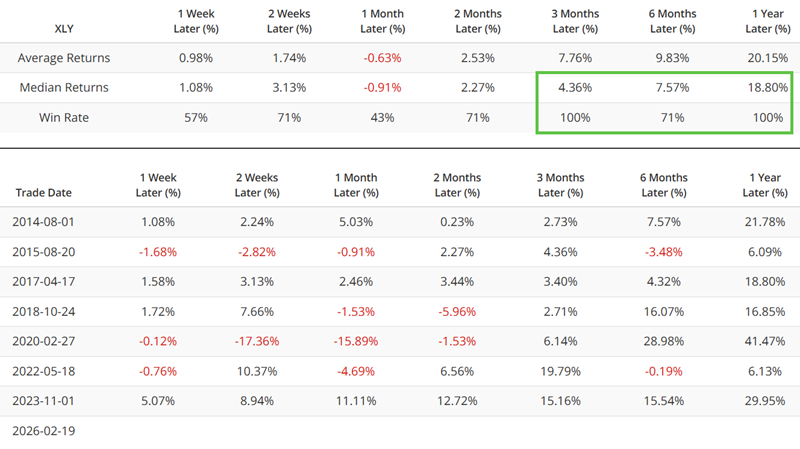
The table below summarizes subsequent XLY performance.
Sector #4: Financials (XLF)
The State Street Financials Select Sector SPDR ETF (XLF) tracks the financial stock sector. The chart below highlights only those dates when the XLF Aggregated Put/Call Ratio crossed above 1.12 for the first time in 12 months. The most recent signal occurred on February 5th. The indicator also spiked up to 1.70 on February 19th.
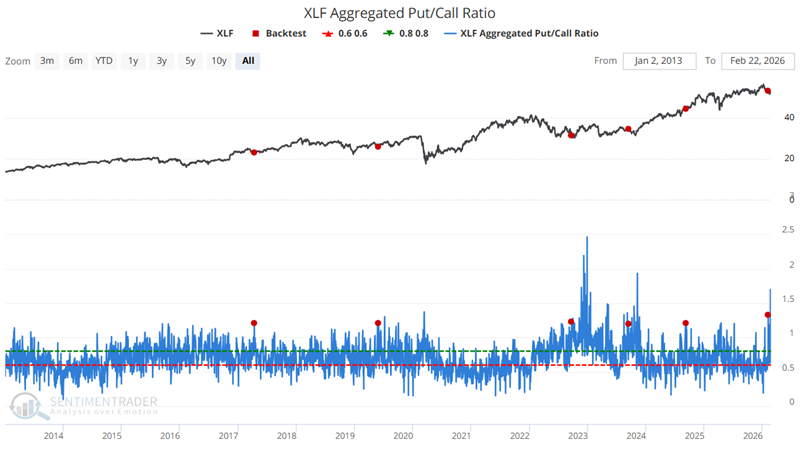
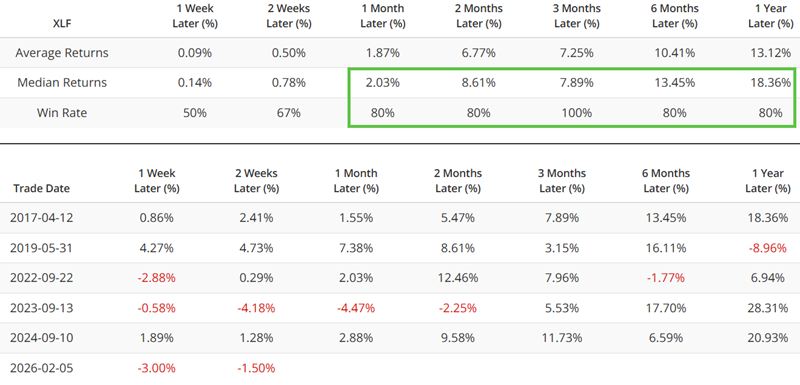
The table below summarizes subsequent XLF performance.
Sector #5: Technology (XLK)
Like the Nasdaq 100 Index, the State Street Technology Select Sector SPDR ETF (XLK) has been trending sideways for many months and lagging the overall market. Given the extent of the previous run-up, there is legitimate concern that the best is over for tech stocks. Still, the recent spike in the XLK Aggregated Put/Call Ratio lends a solid contrarian signal to the favorable side of the weight of the evidence ledger.
The chart below highlights only those dates when the XLK Aggregated Put/Call Ratio crossed above 1.00 for the first time in 12 months. The most recent "first signal in 12 months" signal occurred on January 15th. Ticker XLK is presently down -3.1% from that date. Still, it is worth noting that two subsequent spikes above 1.20 occurred on February 12th and February 19th. The bottom line is that speculators have been betting very heavily against the technology sector in the last month and a half. Historically, they have not been rewarded for doing so.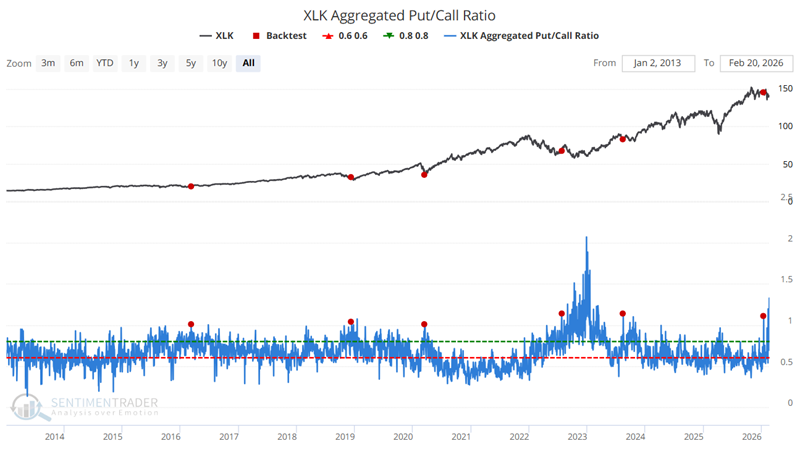
The table below summarizes subsequent XLK performance.
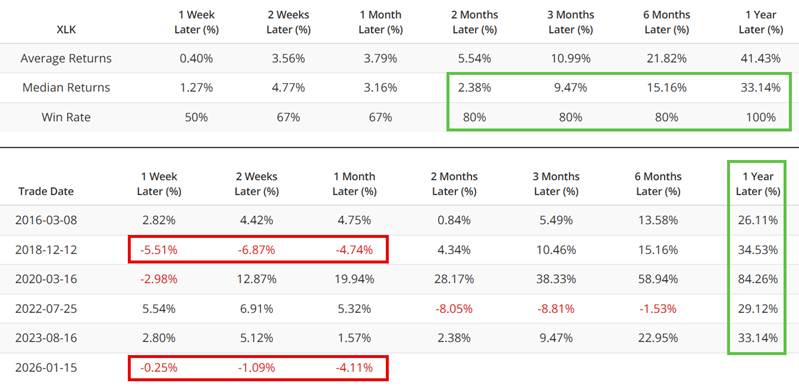
Note that the January 15th signal is off to a lousy start. Note that this type of behavior happened once before, following the 2018-12-12 signal.
What the research tells us…
One mistake people often make is looking at the red dots in charts like the ones above and automatically equating them with a "Buy" signal. Indicator signals (in my opinion) offer information, and do not automatically qualify as a "call to action."
The results detailed above do not guarantee higher prices for the indexes and sectors mentioned over the coming year. But they do offer a stark reminder that sentiment among short-term traders (who have a long history of typically being wrong when they act en masse) is extremely skittish, i.e., they are betting heavily against the prevailing trend - and/or on a market decline. While this action does not by itself constitute an outright "buy" or "all clear" signal, it does alert us to be prepared to play the upside, or at the very least, not to buy into any emerging "doom and gloom" narratives surrounding these areas of the market.