
Surprising Signals from Nasdaq Sentiment and Price Patterns

Key points:
- Recent notes highlighted unfavorable factors for stocks (many new highs and new lows, and concerns regarding seasonal weakness)
- Nevertheless, signals from other indicators suggest an ultimate bull market continuation
- Signals from our QQQ Optix and Nasdaq Buying Climaxes indicators have added weight to the favorable side of the weight of the evidence ledger
Crosscurrents among the indicators
As always, we employ a weight-of-the-evidence approach to analyze the financial markets. While individual indicator signals can at times appear very compelling, no single indicator or indicator signal is ever the "Be-all, end-all" for market analysis. Likewise, at Sentimentrader, we serve as "analysts, not advisors." This means our job is to highlight potentially relevant information that may affect a given market, security, or index, rather than to advise you specifically on what to do with your money.
I mention this because it can be a little jarring for readers to read some unfavorable items one day and then favorable items the next. Do note that some indicator signals are relevant for different timeframes than others. In other words, one indicator may suggest the potential for market weakness over the next several months, while another may suggest that the stock market has a historically high probability of being higher one year from now. Both may be valid, suggesting a near-term correction within a broader bull market.
To wit, in recent days I wrote about potential warning signs for the stock market (see here and here). However, the signals that recently emerged and are detailed below fall firmly into the "favorable for stocks one year from now category." Make of it what you will.
QQQ Optix flashes a surprising signal
The previously high-flying Nasdaq 100 Index has been essentially unchanged since early October. Likewise, signs of "churning" under the surface have appeared (as I highlighted here just two days ago), which often precedes sideways to lower - and often highly volatile - price action in the near-term. That said, QQQ traders appear to have fallen sufficiently into the bearish camp to trigger a favorable signal.
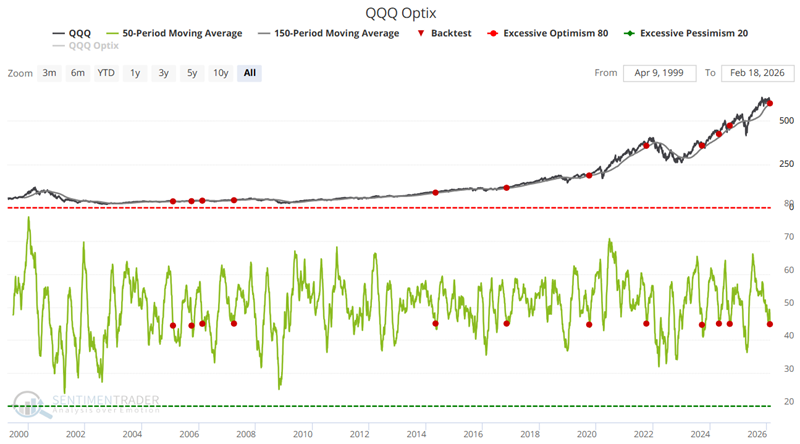
The chart below highlights those dates when:
- The 50-day average of our QQQ Optix indicator crossed below 45
- While QQQ closed above its 150-day moving average
- For the first time in 3 months
A 50-day QQQ Optix average below 45 indicates that negative sentiment has been increasing over several months. As a contrary indicator, this is a favorable sign. Having this happen while QQQ is still above its 150-day average suggests we are witnessing a normal pullback within the context of an ongoing uptrend. The most recent signal occurred on February 17th.
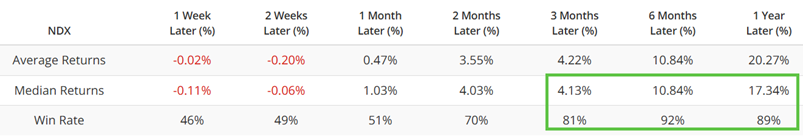
The tables below summarize subsequent QQQ performance and results on a signal-by-signal basis.
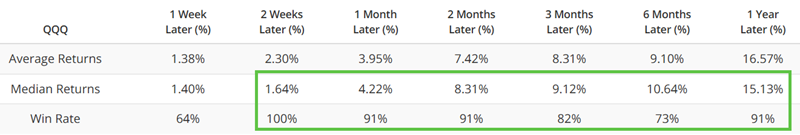
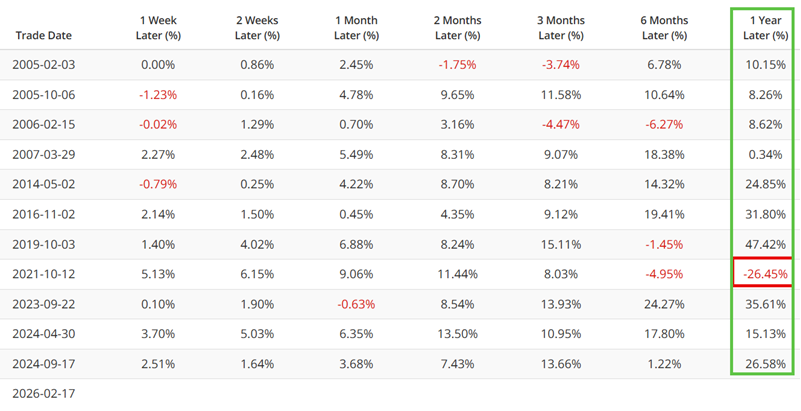
The high Win Rates across time frames foster confidence. However, the 1-year results following the October 2021 signal remind us that no individual signal can be relied upon 100%.
Nasdaq Buying Climaxes trigger a counterintuitive signal
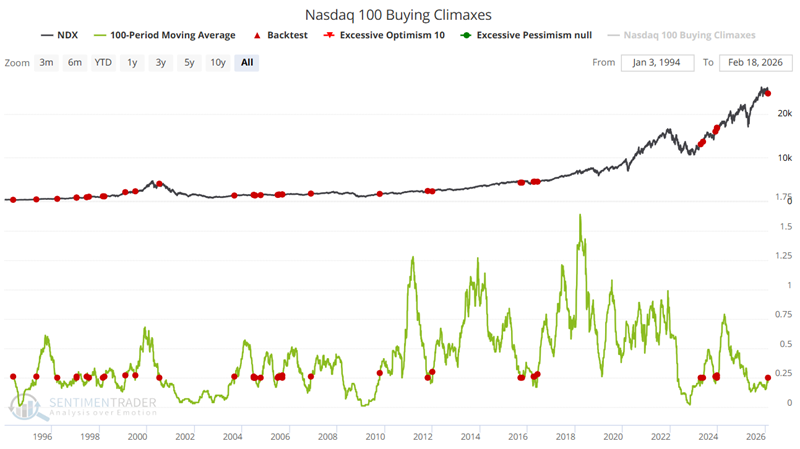
A "buying climax" for a given stock occurs when the stock reaches a 52-week high during the week and then closes below the prior week's close. Intuitively, this suggests a climax in investor buying interest. Our Nasdaq 100 Buying Climaxes indicator considers all the stocks that comprise the Nasdaq 100 Index.
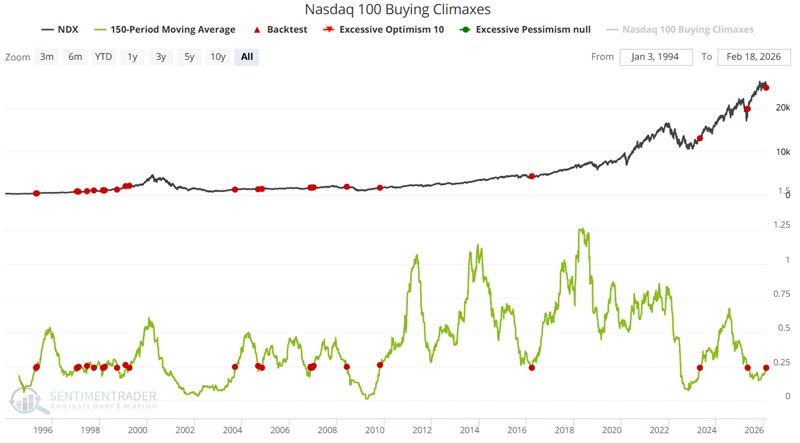
The chart below highlights all dates when the 100-day moving average for our Nasdaq 100 Buying Climax indicator crossed above 0.25, including overlapping signals. The most recent signal occurred on February 17th.
The table below summarizes subsequent QQQ performance.
The table below highlights signal-by-signal results. Note that the July 2000 signal reminds us that no indicator signal should be blindly trusted, nor should it be acted upon without some risk management rules in place.
Now, let's consider a slightly alternate approach. I said earlier that no single indicator should be used in isolation. It is also important to note that most indicators can be used in various ways. The test above used the 100-day moving average for Nasdaq Buying Climaxes. But there is nothing "magic" about a 100-day average. Under the category of "similar but different," The test below highlights all dates when the 150-day moving average of Nasdaq Buying Climaxes crossed above 0.24. This alternate test also generated a signal on February 17th.
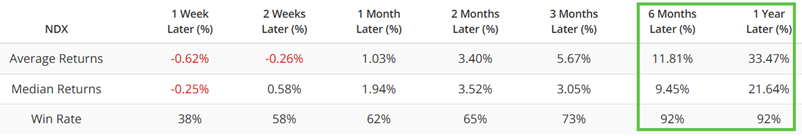
The table below summarizes subsequent QQQ performance. Note the 92% Win Rate for six and twelve-month returns.
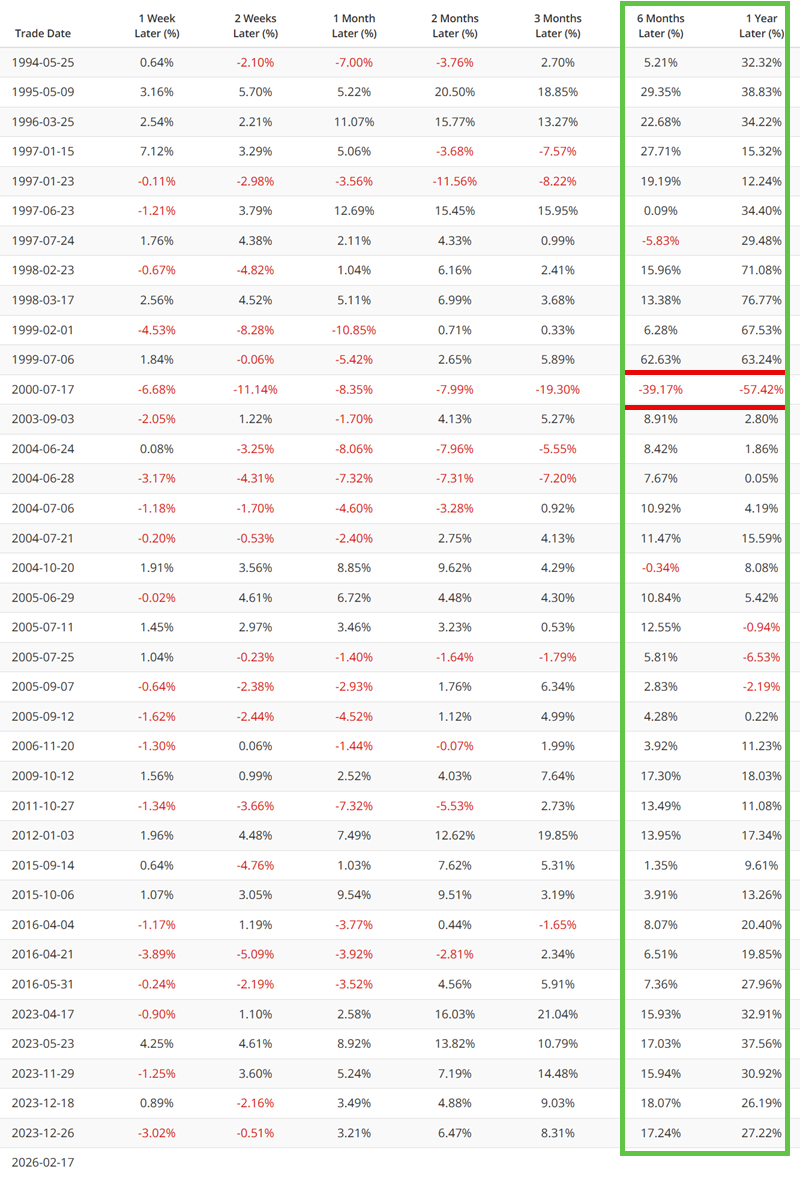
The table below displays signal-by-signal results.
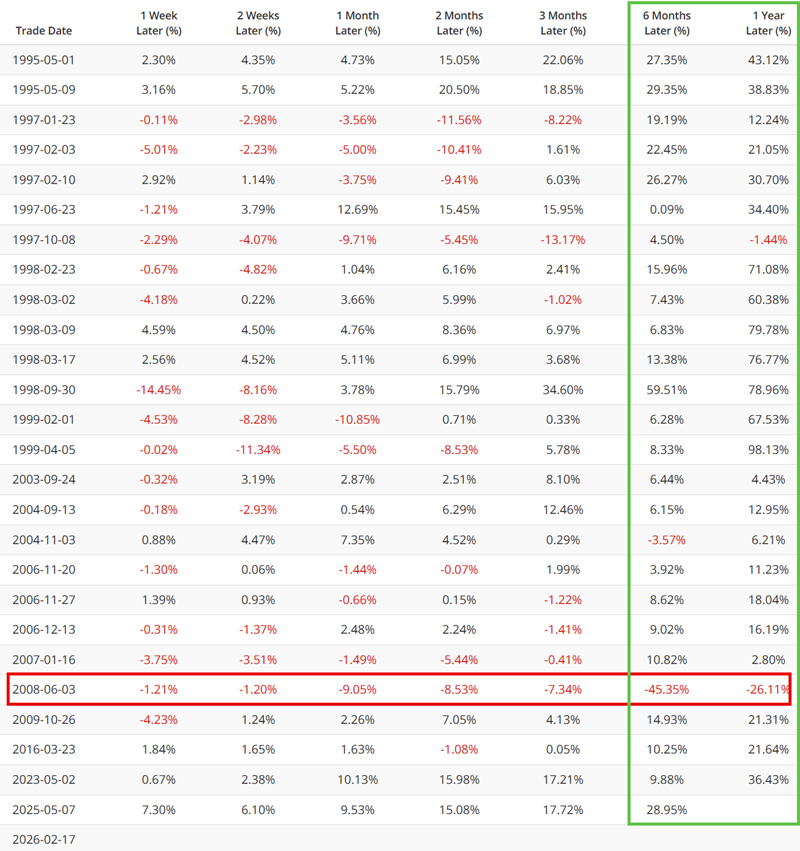
Regarding real-world trading, note that this version sidestepped the bad 2000 signal from the test above, but did flash a signal in June 2008 - just before the market plunge to the eventual 2009 low. The lessons:
- No single indicator signal is ever sure to work the next time it fires
- Risk management planning and execution remain essential tasks for each trader and investor to implement
What the research tells us…
In recent days, I wrote about how "churning in the market suggests that investors might adjust their expectations going forward," and that "a period of seasonal weakness is upon us." So how does one square those ostensibly unfavorable messages with the typically quite favorable signals detailed above?
Ultimately, that is up to each individual to decide. But one line of thought might be to be prepared for near-term market volatility/weakness (based on the unfavorable signals), while maintaining a longer-term favorable stance (based on the results above).