Products
SentimenTrader Trading Tools
‍
Backtest Engine
My Trading Toolkit
Correlation Analysis
Seasonality
Market Prediction
Indicators & Data API
‍
Proprietary Indicators & Charts
Market Data API
Strategies & Scanner
‍
50+ Trading Strategies
Smart Stock Scanner
Smart Option Scanner
Research Reports
‍
Research Solutions
Reports Library
Free Resources
Simple Backtest Calculator
Simple Seasonality Calculator
The Kelly Criterion Calculator
Sentiment Geo Map
Public Research Reports
Education
Sentiment Indicators
Technical Indicators
Pricing
Company
About
In the News
Testimonials
Client Success Stories
Contact
Log inLoginSign up
< BACK TO ALL REPORTS

Surge In Financials At 52-Week Highs

Jason Goepfert
2016-12-09
null

One of the most notable developments in stocks in recent days has been the surge in the number of stocks reaching 52-week highs. As noted in Thursday's report, across the NYSE and Nasdaq exchanges, we're seeing one of the largest breakouts in 30 years.

That's often a good sign long-term, but outside of nascent bull markets, which this is not, it's best viewed as a sign of short- and even medium-term exhaustive buying pressure.

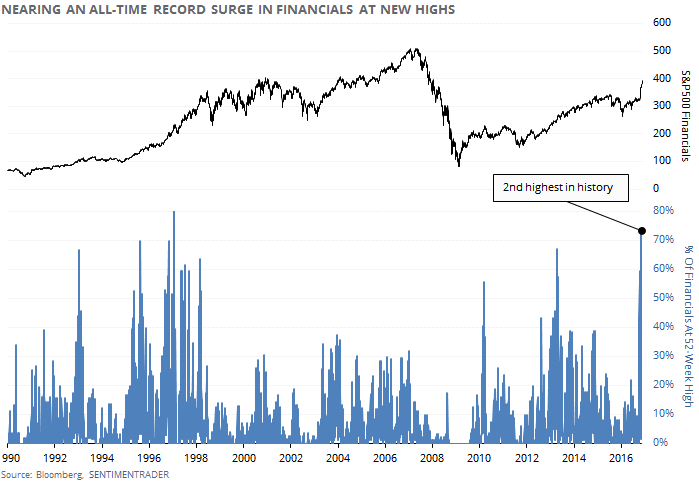
And nowhere is that more acute than in financials. Data for Thursday now show that the S&P 500 financial sector has 73% of their members trading at a 52-week high, an astounding figure that is the 2nd-highest since 1990. Only February 13, 1997, saw more financials at a new high at the same time.

20161208_financials_chart

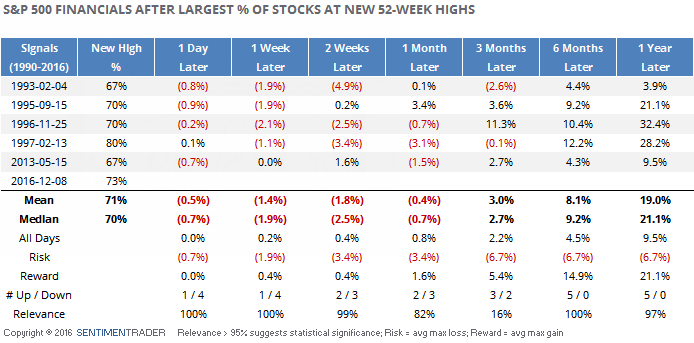
After that surge, financials pulled back by over 3% in the next couple of weeks. That wasn't unusual. The table below shows the 5 largest surges in 52-week highs among financial stocks, and essentially every time, the sector pulled back. There is no doubt that momentum is impressive in the sector - the problem is that it seems to have entered panic mode and that rarely lasts.

20161208_financials_table

On an unrelated note, we've been watching what appears to be a single large trader in the Rydex family of mutual funds. For most of this year, s/he has been moving into and out of the Nova fund, which tracks movement in the S&P 500. The trader will shift between $40 - $130 million into and out of the fund in a single day, and much of that money seems to find its way into the Tempest fund that profits on a decline in the S&P.

For the most part, s/he has been smart money. When the trader jumped into Nova and/or out of Tempest, thus making a bullish bet on stocks, the S&P rallied over the next week 15 out of 20 times and sported an average return of +0.7%.

When the trader moved out of Nova and/or into Tempest (betting on a decline), then the S&P rallied only 10 out of 21 times, averaging a return of -0.1%.

On Thursday, this trader moved $137 million out of Nova, their largest move yet, betting on a decline in stocks.

PRODUCTS
SentimenTrader
Trading Tools
Indicators & Data API
‍
Strategies & Scanner
‍
Research Reports
FREE
RESOUrCES
Simple Backtest
Calculator
Simple Seasonality
Calculator
The Kelly Criterion
Calculator
Sentiment Geo Map
‍
Public Research Reports
‍
Education
Sentiment Indicators
‍
Technical Indicators
‍
Pricing
Bundle pricing
‍
FAQ
‍
Announcements
‍
COMPANY
‍
About
‍
In the News
‍
Testimonials
‍
Client Success Stories
CONTACT
‍
General Inquiries
‍
Media Inquiries
‍
Financial Professionals Inquiries
‍
© 2026 Sundial Capital Research Inc. All rights reserved.
Setsail Marketing
TermsPrivacyAffiliate Program
Risk Disclosure: The information and tools provided are for research and analytical purposes only and are not intended as investment advice. Market analysis involves uncertainty, and outcomes may differ from expectations. Users should conduct their own due diligence and consider their individual circumstances before making any financial decisions. Past performance is not necessarily indicative of future results.

Hypothetical Performance Disclosure: Hypothetical performance results have many inherent limitations, some of which are described below. No representation is being made that any account will or is likely to achieve profits or losses similar to those shown; in fact, there are frequently sharp differences between hypothetical performance results and the actual results subsequently achieved by any particular trading program. One of the limitations of hypothetical performance results is that they are generally prepared with the benefit of hindsight. In addition, hypothetical trading does not involve financial risk, and no hypothetical trading record can completely account for the impact of financial risk of actual trading. for example, the ability to withstand losses or to adhere to a particular trading program in spite of trading losses are material points which can also adversely affect actual trading results. There are numerous other factors related to the markets in general or to the implementation of any specific trading program which cannot be fully accounted for in the preparation of hypothetical performance results and all which can adversely affect trading results.

Testimonial Disclosure: Testimonials appearing on this website may not be representative of other clients or customers and is not a guarantee of future performance or success.