Products
SentimenTrader Trading Tools
‍
Backtest Engine
My Trading Toolkit
Correlation Analysis
Seasonality
Market Prediction
Indicators & Data API
‍
Proprietary Indicators & Charts
Market Data API
Strategies & Scanner
‍
50+ Trading Strategies
Smart Stock Scanner
Smart Option Scanner
Research Reports
‍
Research Solutions
Reports Library
Free Resources
Simple Backtest Calculator
Simple Seasonality Calculator
The Kelly Criterion Calculator
Sentiment Geo Map
Public Research Reports
Education
Sentiment Indicators
Technical Indicators
Pricing
Company
About
In the News
Testimonials
Client Success Stories
Contact
Log inLoginSign up
< BACK TO ALL REPORTS

Sugar looks sweet...but will history repeat?

Jay Kaeppel
2025-02-21
In the last month, sugar has rallied almost 20% off a solid long-term base. That's the good news. The bad news is that the months ahead have tended to show weakness. We break down the current status and the sordid history herein.

Key Points

  • After successfully testing a multi-year low, sugar has recently rebounded strongly
  • However, history suggests that traders be very cautious (i.e., use tight stops) about trading the long side…
  • …and look for an opportunity to play the short side in the months ahead

Sugar price action is arguably very favorable

The chart below shows price action for sugar futures for the past several years.

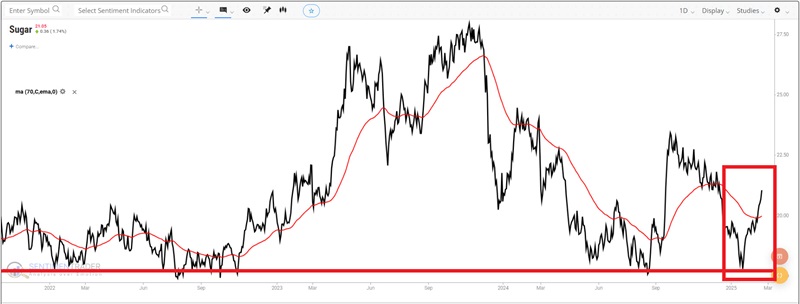
The key thing to note is how often sugar successfully tested the 17.50-18.00 range without breaking lower. This type of long-term support level can be a launching pad for a significantly higher move. And as we see at the far right, so far so good for sugar. Prices have bounced over 18% higher in the last month and moved back above the 70-day exponential moving average.

In terms of pure trend, the long side of sugar appears like the place to be as it is hard to argue a bearish case for sugar. But it may be a good time to pay close attention.

Sugar is entering its weakest seasonal time of year

Sugar has a long history of being a very cyclical market. The chart below shows the annual seasonal trend for sugar futures. As highlighted in red, this market is entering what is generally the weakest time of year.

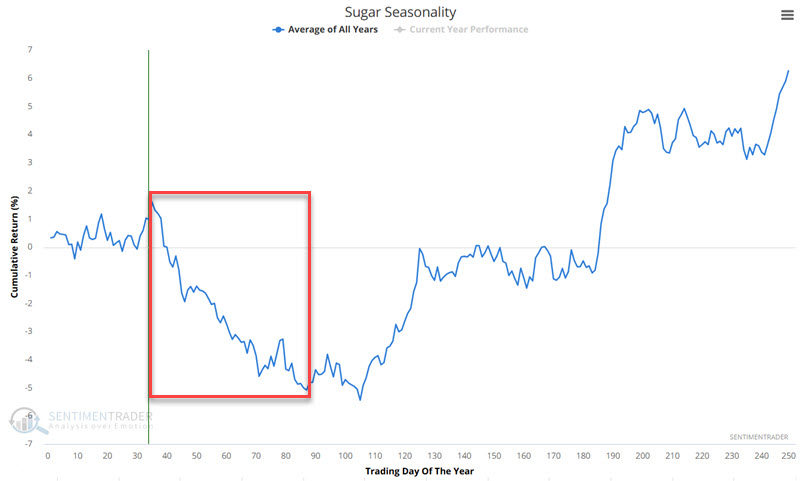
As always, it is important to remind people that seasonality is backward-looking-i.e., it is simply an average of the past-and should never be thought of as a roadmap for what will happen in the current year. Still, history is what it is for sugar.

The chart below shows the annual seasonal trend, with price action for sugar so far this year overlaid. Early-year weakness was followed by a strong rebound into late February. This type of action is fairly typical for sugar.

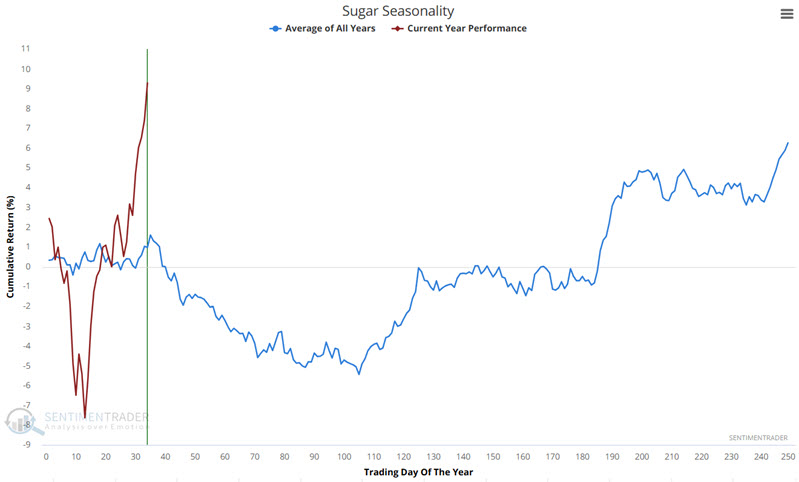
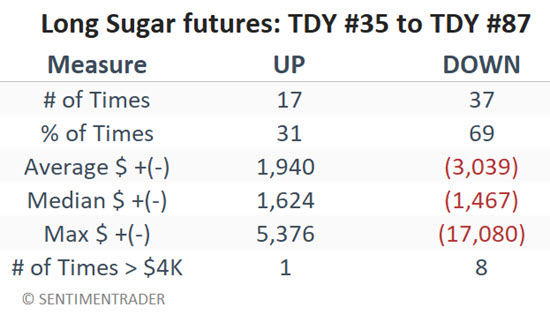
The period of typical seasonal weakness highlighted above extends from the close of Trading Day of the Year (TDY) #35 through TDY #87. For 2025, this period extends from the close on 2025-02-21 through 2025-05-07.

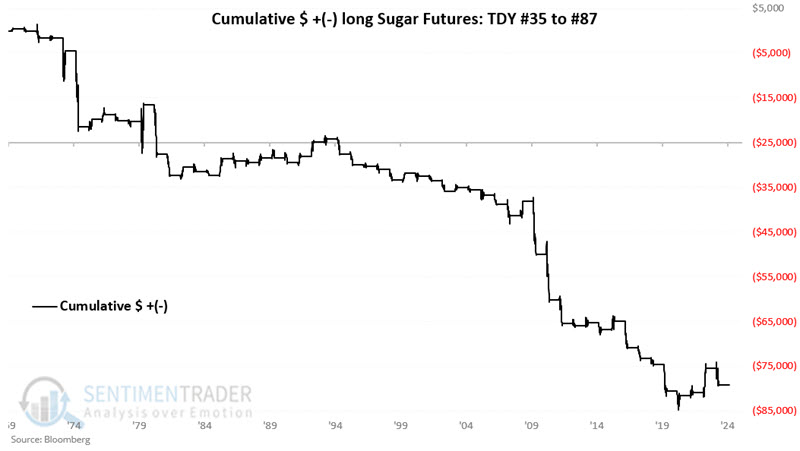
The table below summarizes sugar performance during the TDY #35 to #87 period.

What the research tells us…

The chart and table above show the historical tendency for weakness during early spring. That said, it must be noted that a 31% Win Rate means that sugar has advanced and not declined in roughly 3 out of every 10 years during this period (i.e., this is no bearish "sure thing"). Additionally, in 2023, sugar futures rallied over $5,300 in contract value during this purportedly "bearish" period - and over $3,000 during four other years (i.e., do not sell short and stubbornly hold on without a stop-loss). Given the history combined with recent price action, the message appears to be "Don't fight the trend, BUT be alert for an opportunity to play the short side in the months ahead."

PRODUCTS
SentimenTrader
Trading Tools
Indicators & Data API
‍
Strategies & Scanner
‍
Research Reports
FREE
RESOUrCES
Simple Backtest
Calculator
Simple Seasonality
Calculator
The Kelly Criterion
Calculator
Sentiment Geo Map
‍
Public Research Reports
‍
Education
Sentiment Indicators
‍
Technical Indicators
‍
Pricing
Bundle pricing
‍
FAQ
‍
Announcements
‍
COMPANY
‍
About
‍
In the News
‍
Testimonials
‍
Client Success Stories
CONTACT
‍
General Inquiries
‍
Media Inquiries
‍
Financial Professionals Inquiries
‍
© 2026 Sundial Capital Research Inc. All rights reserved.
Setsail Marketing
TermsPrivacyAffiliate Program
Risk Disclosure: The information and tools provided are for research and analytical purposes only and are not intended as investment advice. Market analysis involves uncertainty, and outcomes may differ from expectations. Users should conduct their own due diligence and consider their individual circumstances before making any financial decisions. Past performance is not necessarily indicative of future results.

Hypothetical Performance Disclosure: Hypothetical performance results have many inherent limitations, some of which are described below. No representation is being made that any account will or is likely to achieve profits or losses similar to those shown; in fact, there are frequently sharp differences between hypothetical performance results and the actual results subsequently achieved by any particular trading program. One of the limitations of hypothetical performance results is that they are generally prepared with the benefit of hindsight. In addition, hypothetical trading does not involve financial risk, and no hypothetical trading record can completely account for the impact of financial risk of actual trading. for example, the ability to withstand losses or to adhere to a particular trading program in spite of trading losses are material points which can also adversely affect actual trading results. There are numerous other factors related to the markets in general or to the implementation of any specific trading program which cannot be fully accounted for in the preparation of hypothetical performance results and all which can adversely affect trading results.

Testimonial Disclosure: Testimonials appearing on this website may not be representative of other clients or customers and is not a guarantee of future performance or success.