Data &
Technology
Research
Reports
Report Solutions
Reports Library
Actionable
Strategies
Free
Resources
Simple Backtest Calculator
Simple Seasonality Calculator
The Kelly Criterion Calculator
Sentiment Geo Map
Public Research Reports
Free Webinar
Pricing
Company
About
Meet Our Team
In the News
Testimonials
Client Success Stories
Contact
Log inLoginSign up
< BACK TO ALL REPORTS

Style and sector performance in year two after a bear market low

Dean Christians
2021-03-25
Let's review year two after bear market lows to see if we can gain some perspective on what the future might have in store for us over the next 12 months.

On Wednesday, I posted a note to review style and sector performance as the market celebrated the pandemic low's first anniversary. The note's purpose was to review the 1-year return for styles and sectors since the pandemic low and compare it to other bear market lows since 1929. I'm happy to report that the traditional early cycle return patterns since the low offered very little in the way of surprises as measured against history. The relationships held up well.

In today's note, I want to review year two after bear market lows to see if we can gain some perspective on what the future might have in store for us over the next 12 months.

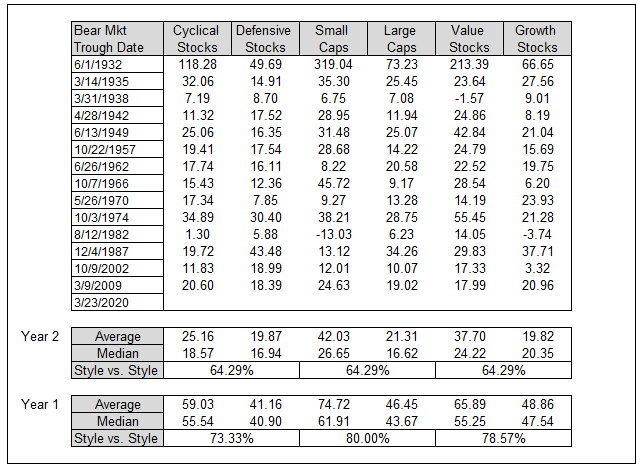
Style Performance Year 2 after Low (% Total Return 12 Months Forward)

While still good, average and median gains are cut in half as the momentum thrust off the low cools down. That's to be expected. The percentage of time one style bucket outperforms the other drops in all three cases. Small over large shows the largest decrease going from 80% in year one to 64.29% in year two.

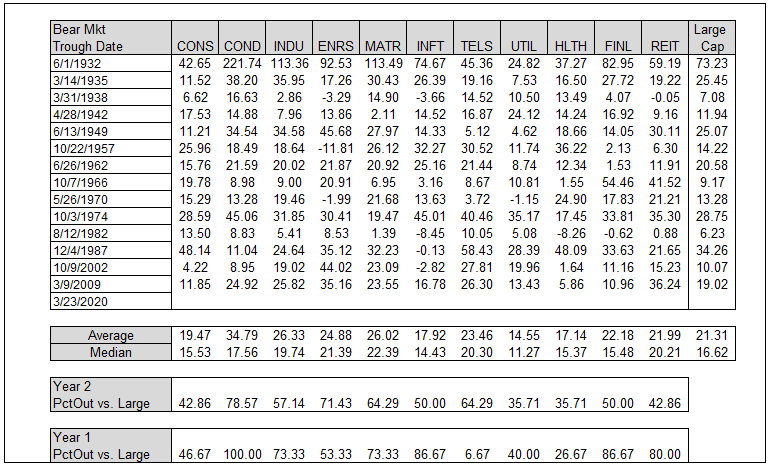
Sector Performance Year 2 after Low (% Total Return 12 Months Forward)

Let's focus our attention on the relative performance as measured by the percentage of time a given sector outperforms large-cap issues from year one to year two in the following table. Consumer Discretionary continues to show the best results on a relative basis versus large-cap stocks even with a decrease from year one to year two. The other early cycle leaders like Technology, Industrials, Financials, and Real Estate show a noticeable decline in the percentage of time they outperform the benchmark. I would also note that Technology is currently on the longest losing steak in year two with four consecutive periods of underperformance. Interestingly, the defensive telecom/communications sector shows a noticeable jump in relative performance and is currently on a five consecutive period win steak. The energy sector shows a nice jump in relative performance in year two with a 71.43% win rate. I would also note that the sector has outperformed for five consecutive periods, matching the telecom/communications group.

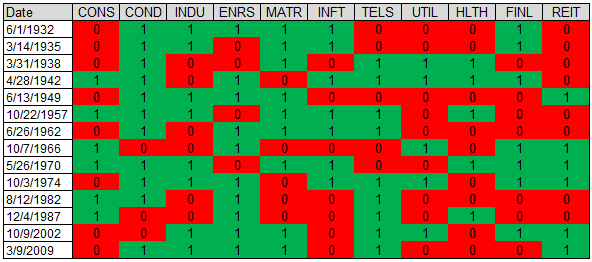
Year Two Sector Relative Performance vs. Large-Cap  (1 Outperform -  0 Underperform)
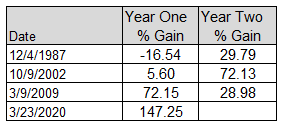
Crude Oil 

Given the jump in relative performance for the energy sector in year two, I thought it would be a good idea to show crude oil performance in years one and two after the equity bear market lows.

Please note, the former Telecommunications sector was reshuffled in 2018. Technology companies like Facebook and Alphabet were added to what is now a new communications sector. As a result, the sector may not be as defensive as the former group.


Sorry, you don't have access to this report

Upgrade your subscription plan to get access
Go to Dasboard
DATA &
TECHnologies
IndicatorEdge
‍
BackTestEdge
‍
Other Tools
‍
DataEdge API
RESEARCH
reports
Research Solution
‍
Reports Library
‍
actionable
Strategies
Trading Strategies
‍
Smart Stock Scanner
‍
FREE
RESOUrCES
Simple Backtest
Calculator
Simple Seasonality
Calculator
The Kelly Criterion
Calculator
Sentiment Geo Map
‍
Public Research Reports
‍
Free Webinar
COMPANY
‍
About
‍
Meet our Team
‍
In the News
‍
Testimonials
‍
Client Success Stories
Pricing
Bundle pricing
‍
Announcements
‍
FAQ
© 2024 Sundial Capital Research Inc. All rights reserved.
Setsail Marketing
TermsPrivacyAffiliate Program
Risk Disclosure: Futures and forex trading contains substantial risk and is not for every investor. An investor could potentially lose all or more than the initial investment. Risk capital is money that can be lost without jeopardizing ones’ financial security or life style. Only risk capital should be used for trading and only those with sufficient risk capital should consider trading. Past performance is not necessarily indicative of future results.

Hypothetical Performance Disclosure: Hypothetical performance results have many inherent limitations, some of which are described below. No representation is being made that any account will or is likely to achieve profits or losses similar to those shown; in fact, there are frequently sharp differences between hypothetical performance results and the actual results subsequently achieved by any particular trading program. One of the limitations of hypothetical performance results is that they are generally prepared with the benefit of hindsight. In addition, hypothetical trading does not involve financial risk, and no hypothetical trading record can completely account for the impact of financial risk of actual trading. for example, the ability to withstand losses or to adhere to a particular trading program in spite of trading losses are material points which can also adversely affect actual trading results. There are numerous other factors related to the markets in general or to the implementation of any specific trading program which cannot be fully accounted for in the preparation of hypothetical performance results and all which can adversely affect trading results.

Testimonial Disclosure: Testimonials appearing on this website may not be representative of other clients or customers and is not a guarantee of future performance or success.