
Strong quarters tend to beget strong quarters

Key points
- The S&P 500 Index surged +11.2% during the fourth quarter of 2023
- Does this matter at all in the future?
- We examine the history of quarterly performance so investors can draw their conclusions
Strength tends to beget strength in the stock market
It is a relatively widely accepted opinion that the most bullish thing that stocks can do is go up in price. While that seems pretty evident, strength often tends to beget more strength in the stock market. That is the reason the phrase "breadth thrust" exists. Subjectively, the fact that the S&P 500 Index rallied +11.2% for the fourth quarter of 2023 should be viewed as a favorable development. Is this based on reality?
In the tests below, we will look at the quarterly performance of the S&P 500 Index since 1920 versus its performance during the next quarter.
Setting a baseline
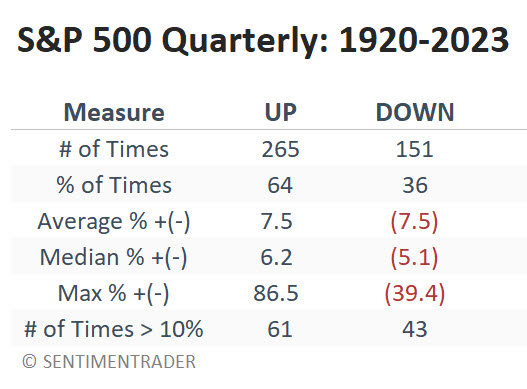
We analyze every quarter since 1920, i.e., looking at the 3-month returns at the end of every March, June, September, and December. The table below summarizes the overall S&P 500 quarterly performance.
Now, let's look at quarterly performance based on the performance during the previous quarter.
Quarters that gained +9.25% or more
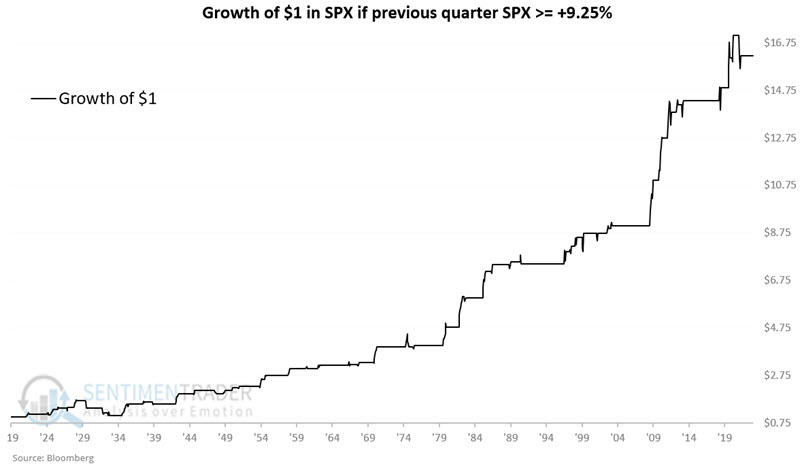
For this test, we will buy and hold the S&P 500 Index for three months at the end of any quarter that shows a gain of 9.25% or more for the S&P 500 Index. The chart below displays the growth of $1 invested in the S&P 500 Index for three months only if the previous quarter ended with a gain of +9.25% or more.
The table below displays the same information on a logarithmic scale.
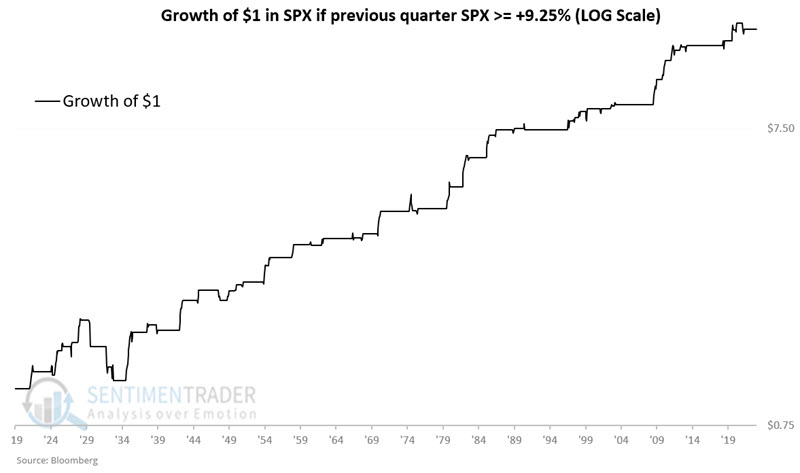
As you can see, the 1930's saw the market take some hits even after a solid up quarter. Beyond that, the last 90 years have seen some pretty consistent performance in the quarter following a +9.25% quarter.
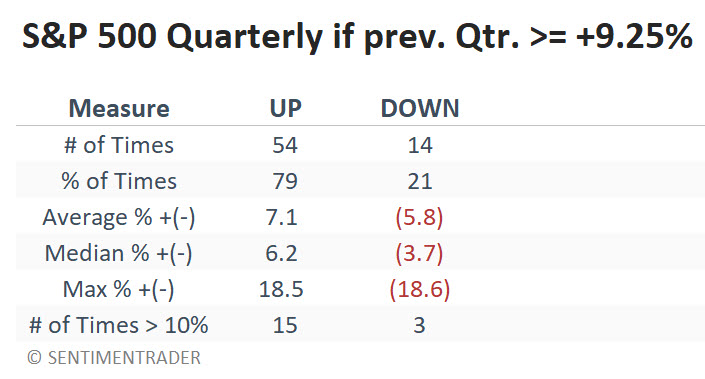
The table below summarizes S&P 500 performance during these quarters. Interestingly, the average and median gains are slightly lower and the same, respectively, versus all quarters. The critical difference is the significantly higher Win Rate (79% versus 64%) and the smaller average and median losses during down quarters. Note also that quarterly gains of +10% or more skew 15-to-3 in favor of up quarters following quarterly gains of +9.25% or more.
Quarters that lost -15% or more
Another common theory is that if the stock market gets too far oversold, it will likely rally. For this test, we will buy and hold the S&P 500 Index for three months at the end of any quarter that shows a loss of -15% or more for the S&P 500 Index. The chart below displays the growth of $1 invested in the S&P 500 Index for three months only if the previous quarter ended with a loss of -15% or more.
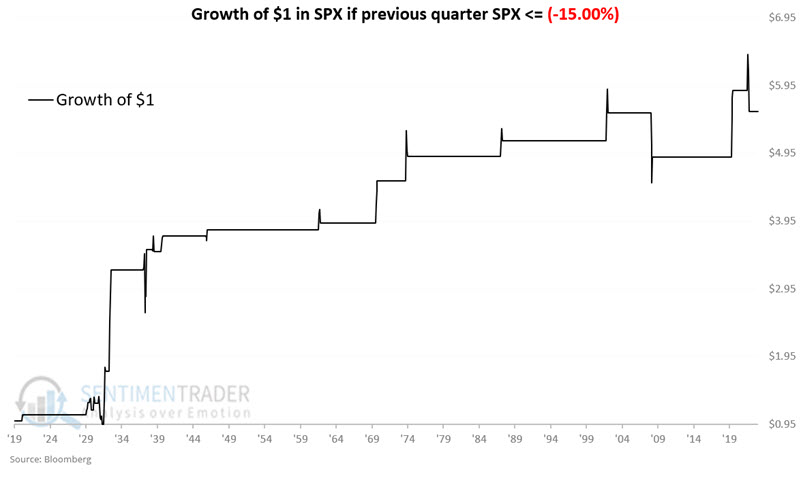
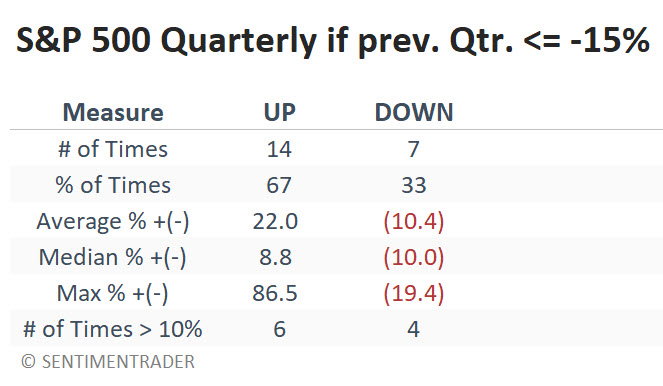
The table below summarizes S&P 500 performance during these quarters. The Win Rate was slightly better than average, with 2 of 3 periods (67%) showing a gain.
Quarters that gained less than +9.25% and lost less than -15%
Now, let's look at all the other quarters inside the extremes. For this test, we will buy and hold the S&P 500 Index for three months at the end of any quarter that shows a return of less than +9.25% and more than -15%. The chart below displays the growth of $1 invested in the S&P 500 Index during these periods
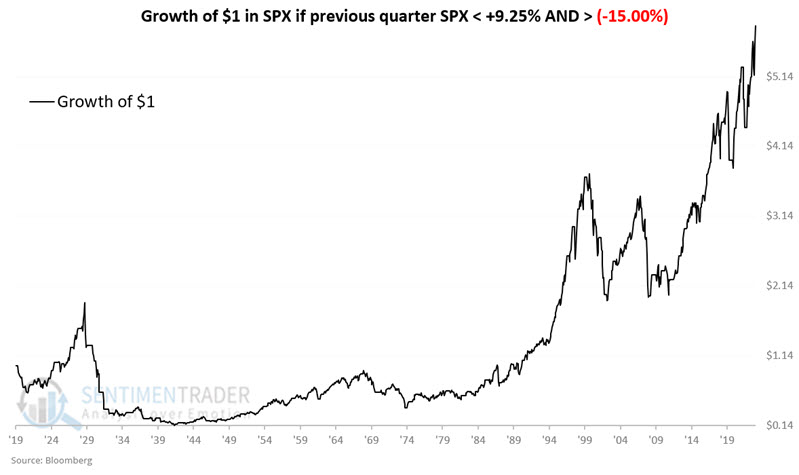
The chart below shows the same data on a logarithmic basis.
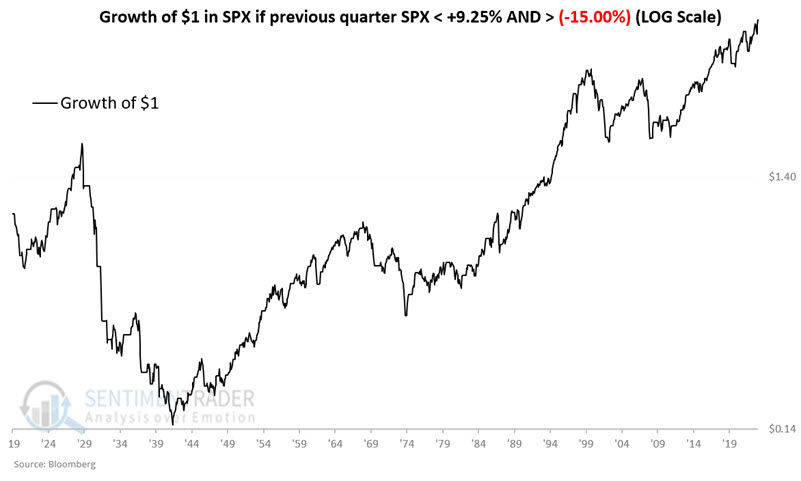
The table below summarizes S&P 500 performance during these quarters.
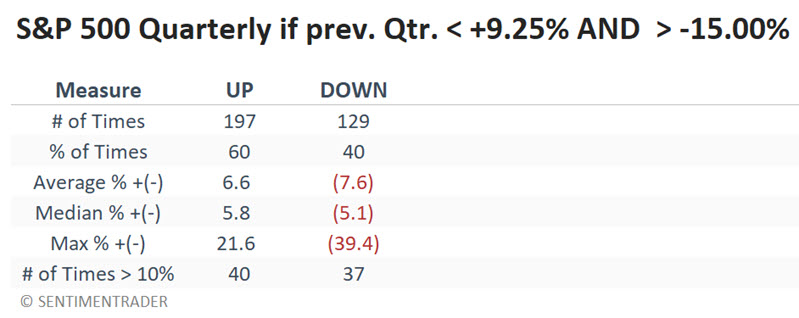
The Win Rate is below average at 60%, and the number of +10% and minus 10% quarters is roughly equal. There appears to be little predictive value to quarters that show a gain of less than +9.25% and more than -15.00%.
What the research tells us…
The results above seem to confirm an anomaly that confuses many investors. Periods of strength - and periods of extreme weakness - both have a tendency (though never a certainty) to be followed by better-than-average price performance. While 2024 is off to a highly lackluster start, history suggests the potential for things to improve significantly before the first quarter winds down.