
Strategy Development - SPY Social Sentiment
In Social Sentiment for Select ETF's, I announced that we now provide social sentiment measures for select ETF's. With this post, I want to share a strategy based on the SPY Social Sentiment.
As a reminder, these social sentiment signals are created from natural language processing of Twitter messages and "Bear/Bull" ratio created. An example of the SPY Social Sentiment indicator is provided in figure 1.
[caption id="attachment_732" align="aligncenter" width="600"]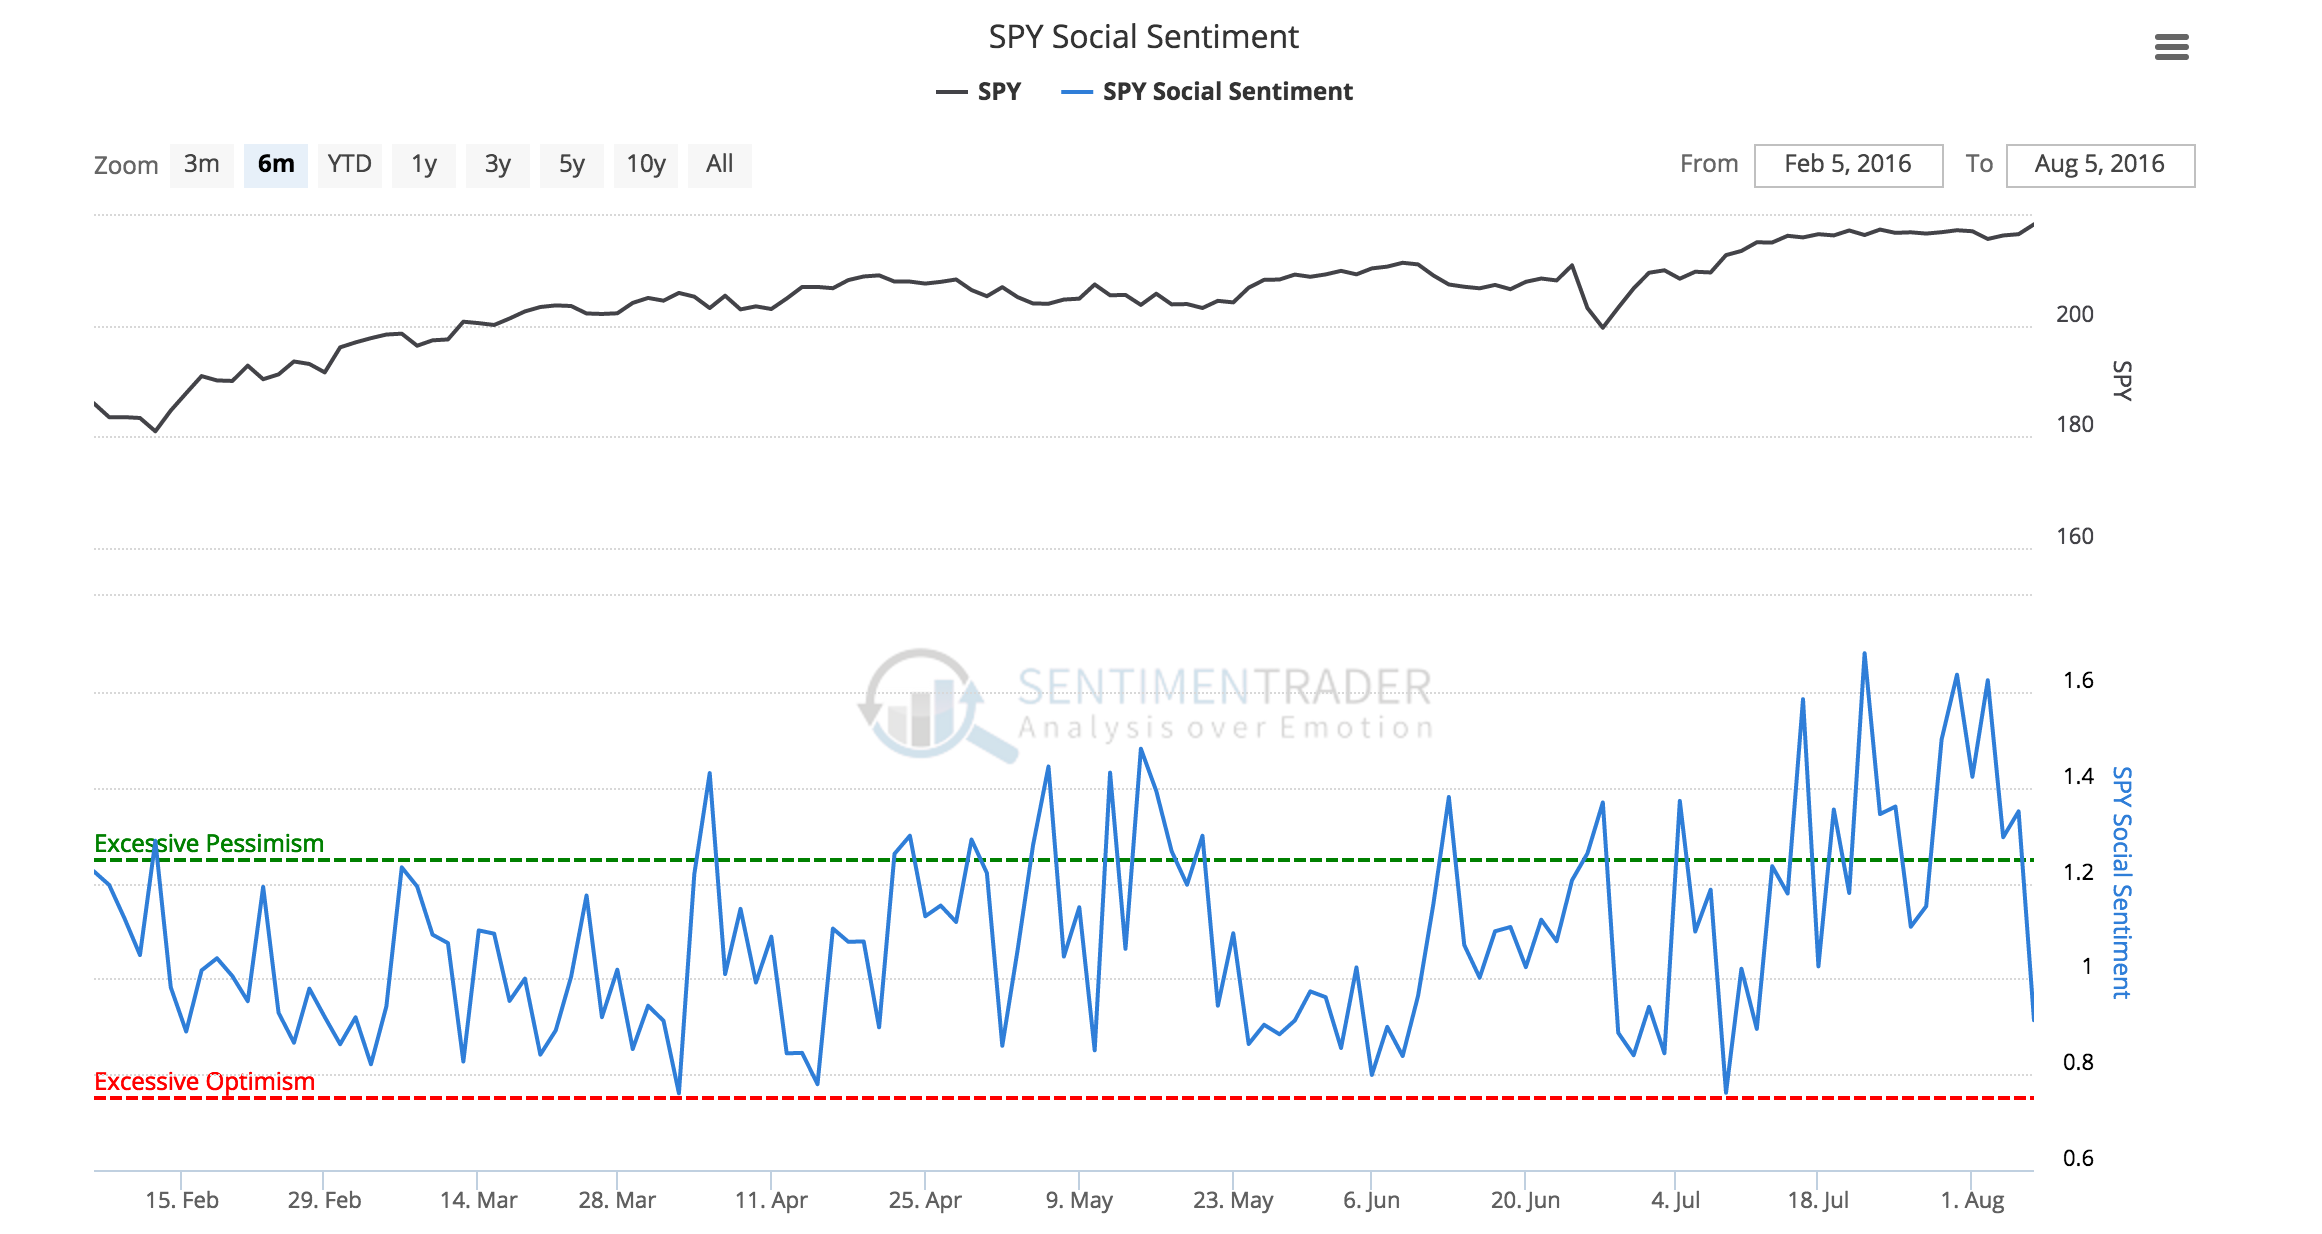 Figure 1: SPY Social Sentiment[/caption]
Building a Strategy with the SPY Social Sentiment indicator
Like the previous strategy, I first take a look at threshold returns for the SPY Social Sentiment indicator to determine annualized returns based on levels of the signal. We can see from the returns shown in Figure 2 that there seems to be a decent return when the sentiment indicator is 'Above Extreme', meaning there is extreme pessimism found within the messages mentioning 'SPY' on Twitter.
[caption id="attachment_751" align="aligncenter" width="597"]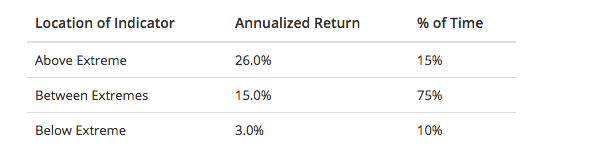 Figure 2: SPY Social Sentiment Threshold Returns[/caption]
Using the SPY Social Sentiment indicator, a Long Only strategy was built. The rules for the strategy are:
- Long only
- No Margin. Starting Account size is $250K.
- 1,000 shares of SPY ETF
- Commission of 0.01% per trade
- $0.01 per share slippage
- Go long when:
- SPY Social Sentiment is greater than or equal to 1.25 (Pessimistic Extreme)
- Close Longs when:
- SPY Social Sentiment is less than or equal to 0.75(Optimistic Extreme)
- All orders are entered at the open of the next day’s trading session after a signal is given.
- There are no stops used. Positions are held until a close signal is given.
Using TradeStation, a strategy was built trading matching these parameters covering Nov 1 2011 to August 17 2016 (Note: Nov 2011 is the start date of social sentiment indicators). During this time frame, there were 22 total trades with a 90.91% win rate and a total profit of $60,240 on a $250,000 account. This is a 24.10% Return on Initial Capital and a 4.53% annual rate of return. During this time, the strategy was in the market just over 27 days per trade on average and was in the market about 61% of the time.
You can see the Equity Curve in Figure 3 below. Click here to download the TradeStation performance summary for the SPY ETF strategy.
[caption id="attachment_753" align="aligncenter" width="600"]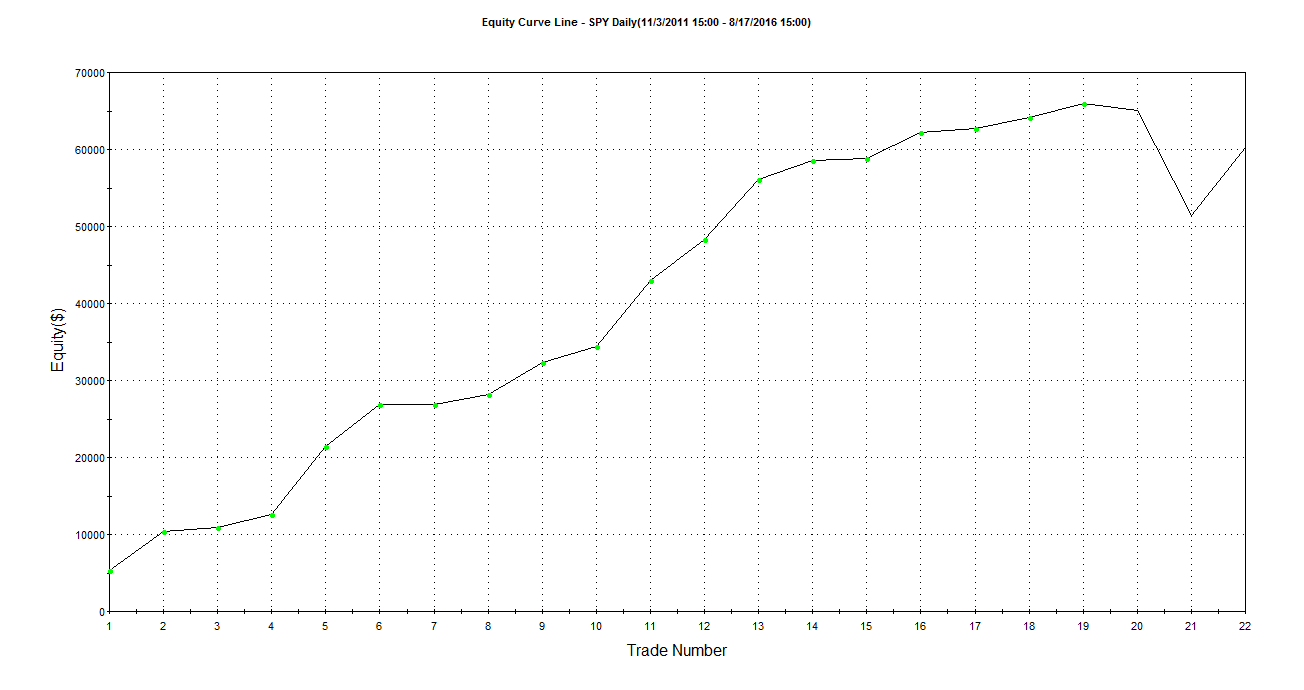 Figure 3: SPY Social Sentiment Equity Curve[/caption]
For this strategy, the average drawdown was $5,261 with a max drawdown of $28,950. With more sophisticated entry / exit rules, the volatility might be decreased (or at least better managed).
Using leverage brings greater returns (and greater volatility) with this strategy. Applying the same logic with the S&P 500 E-mini futures trading 10 contracts, this strategy delivers an annual rate of return of 18.24% and 138.70% Return on Initial Capital from Nov 2011 to Aug 2016. This leverage also brings more drawdown with a max drawdown of about 22% of total account value at the time of drawdown.
You can view the TradeStation performance summaries for more detailed trade statistics by clicking the link below.