
Stocks suffer losses as participation problems persist

Key points:
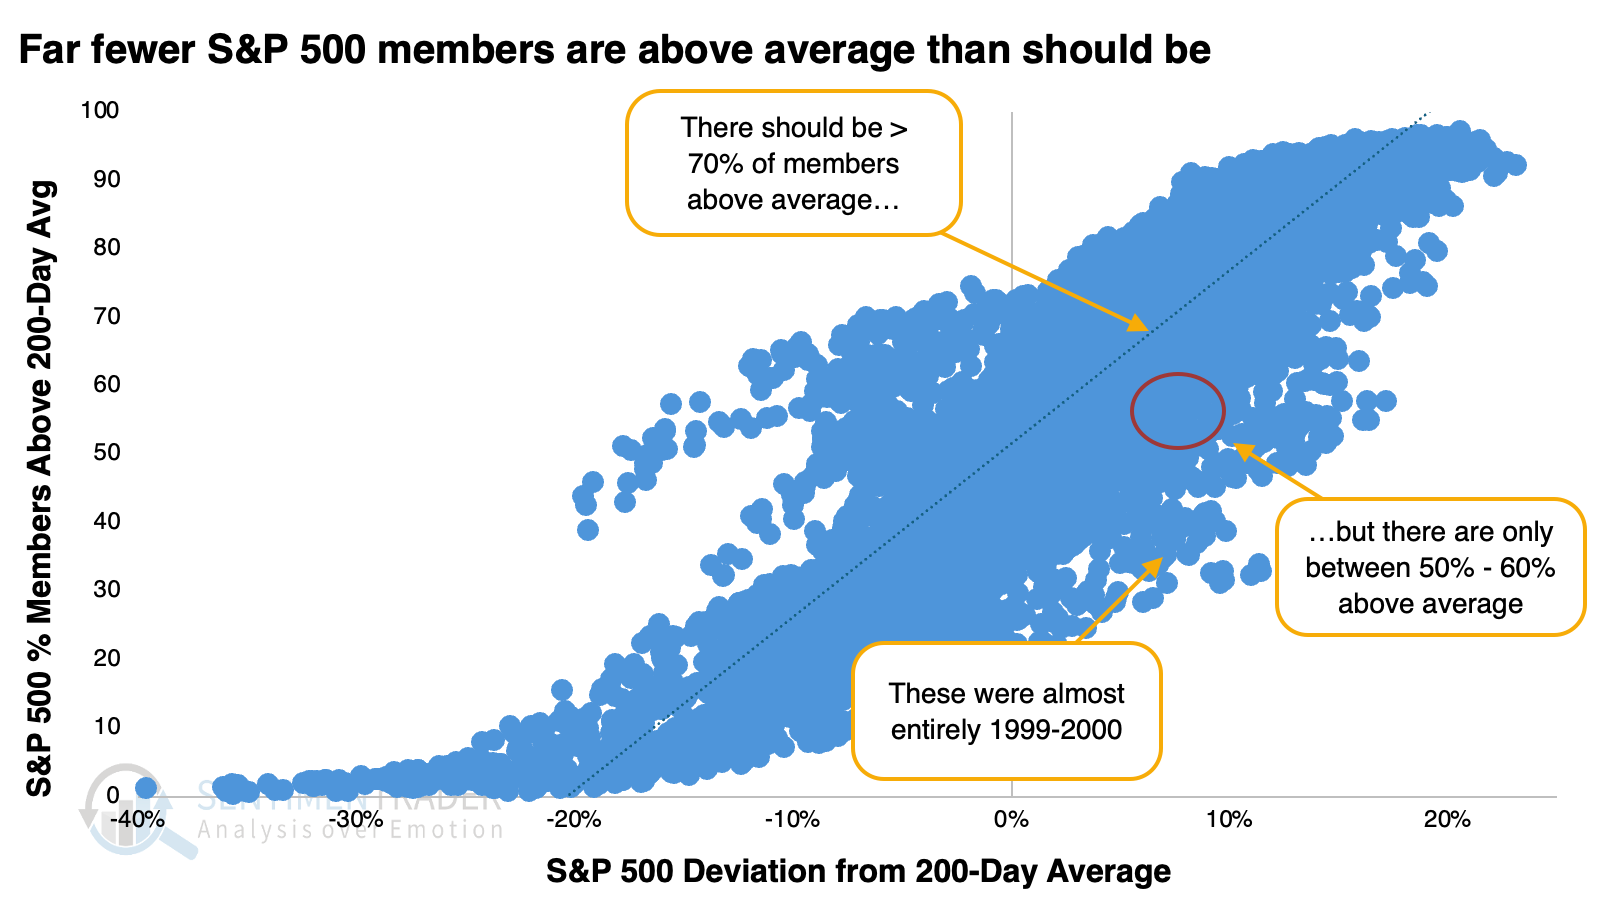
- Given how far the S&P 500 is above its 200-day average, we should expect about 70% of its member stocks to be above theirs
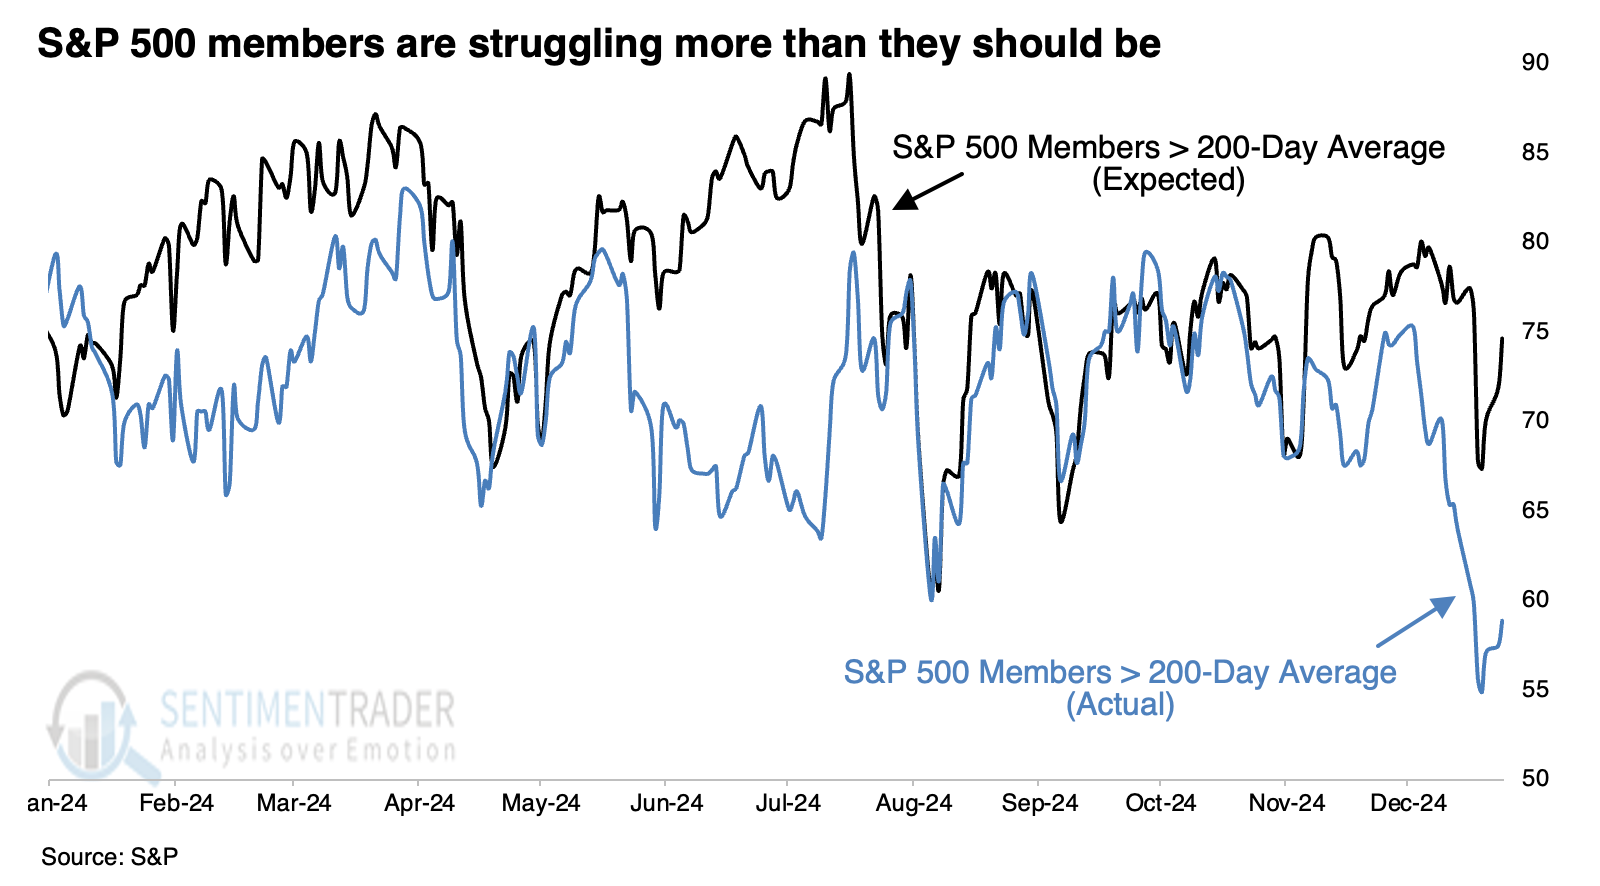
- Fewer than 60% of S&P stocks are above their average, and below-expected participation preceded mixed returns
- Its recent back-to-back large losses may have alleviated some of the negative connotations of its poor participation
Curiously poor participation
The dichotomy between the index and its members continues to grow.
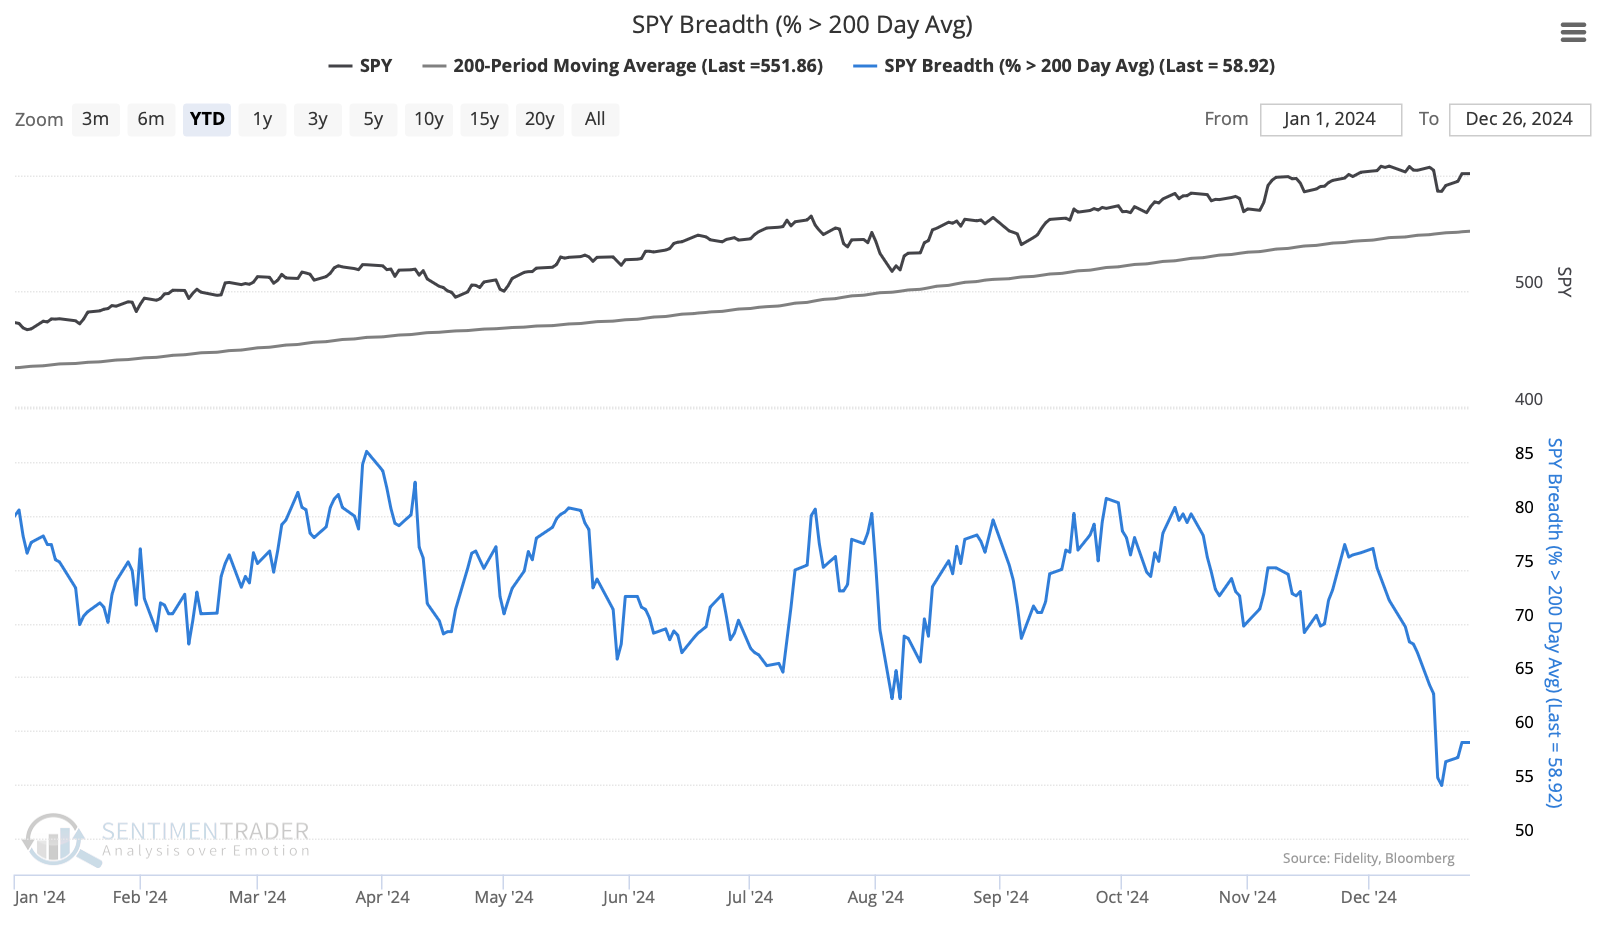
Last week, we noted that despite the S&P 500 being more than 7% above its 200-day moving average, fewer than 60% of its members were above their own 200-day average by any amount. This is the worst participation all year.
This is a historical anomaly dating back nearly 100 years. Using regression analysis, we can estimate that when the S&P is 7% or more above its 200-day average, at least 70% of its member stocks should also be above their 200-day average. The current environment, circled in red, is well below average. The dates worse than the current ones are mostly in 1999-2000.
On Christmas Eve, December 24, the S&P was about 9% above its moving average, but only 59% of its member stocks were above their averages. The regression suggests that 75% of members should have been above their average, so we were seeing a deficit of -16%. In other words, 16% fewer stocks were above their 200-day moving average than should have been.
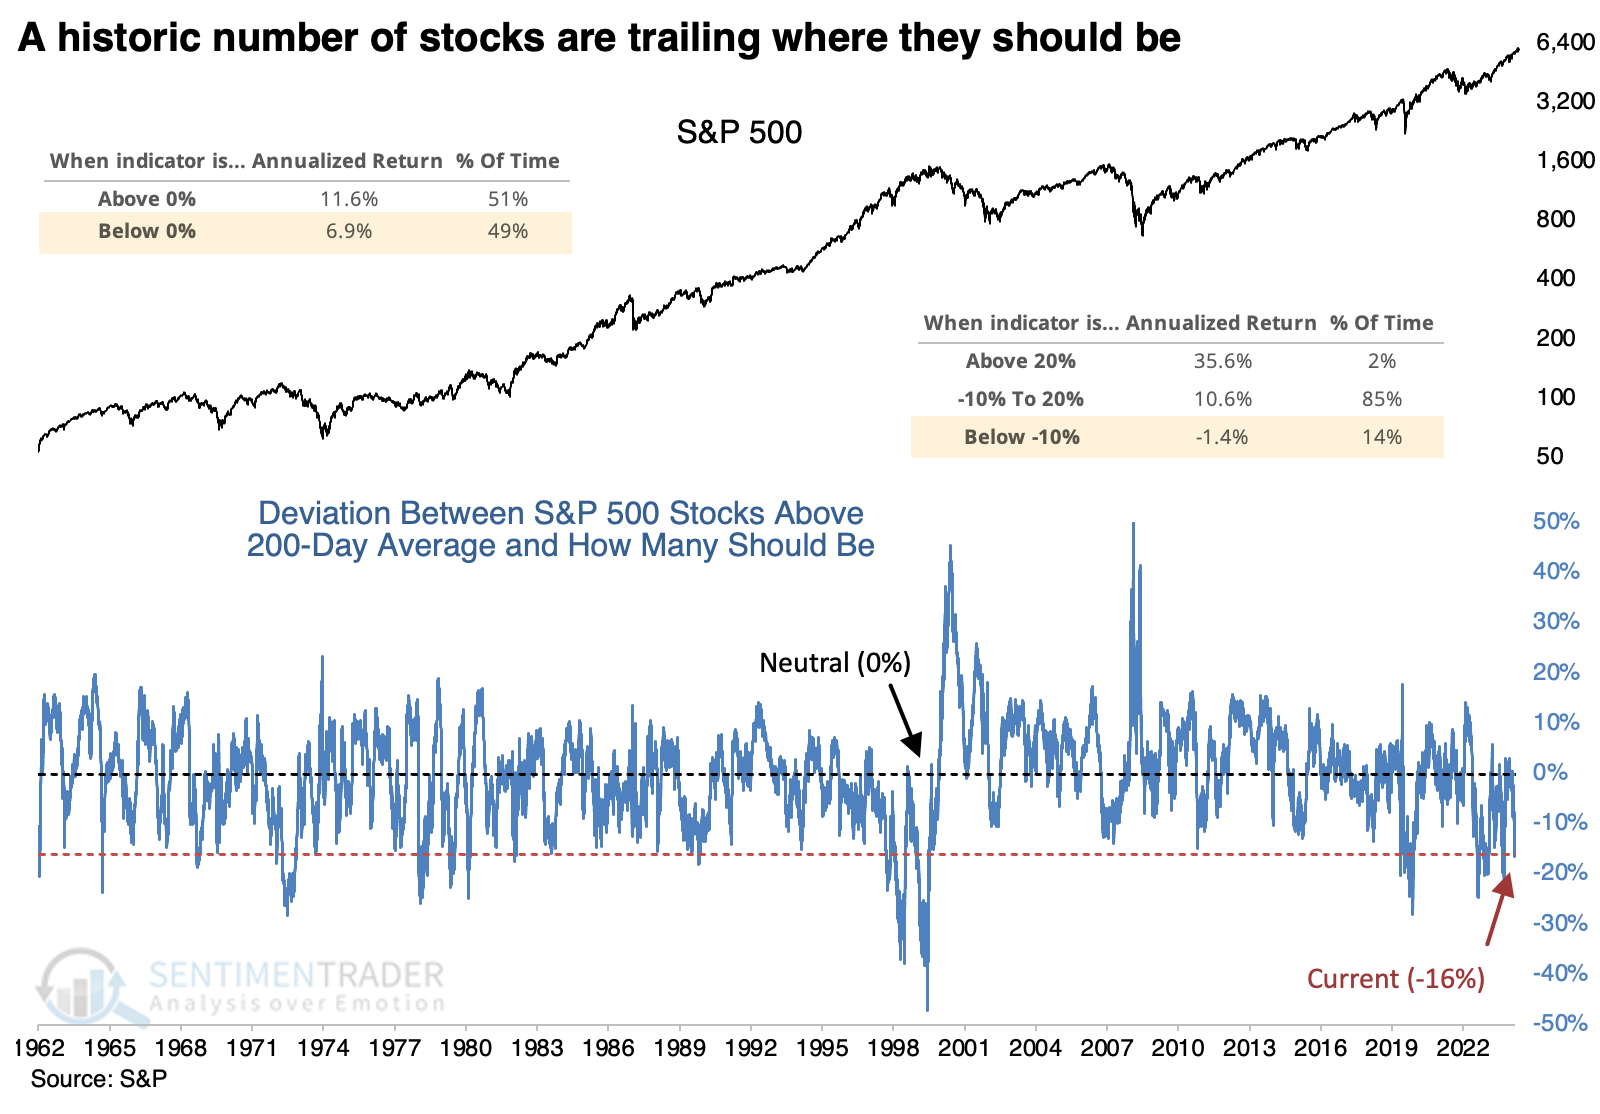
The chart below plots this spread over the past 60 years. We can see from the chart that when the spread is below zero, meaning fewer stocks are above their 200-day average than should be, the S&P 500's forward annualized return is about half what it is when the spread is above zero. And when the spread is below -10%, where it is now, the annualized return falls further to -1.4%.
Breadth deterioration doesn't always mean "sell"
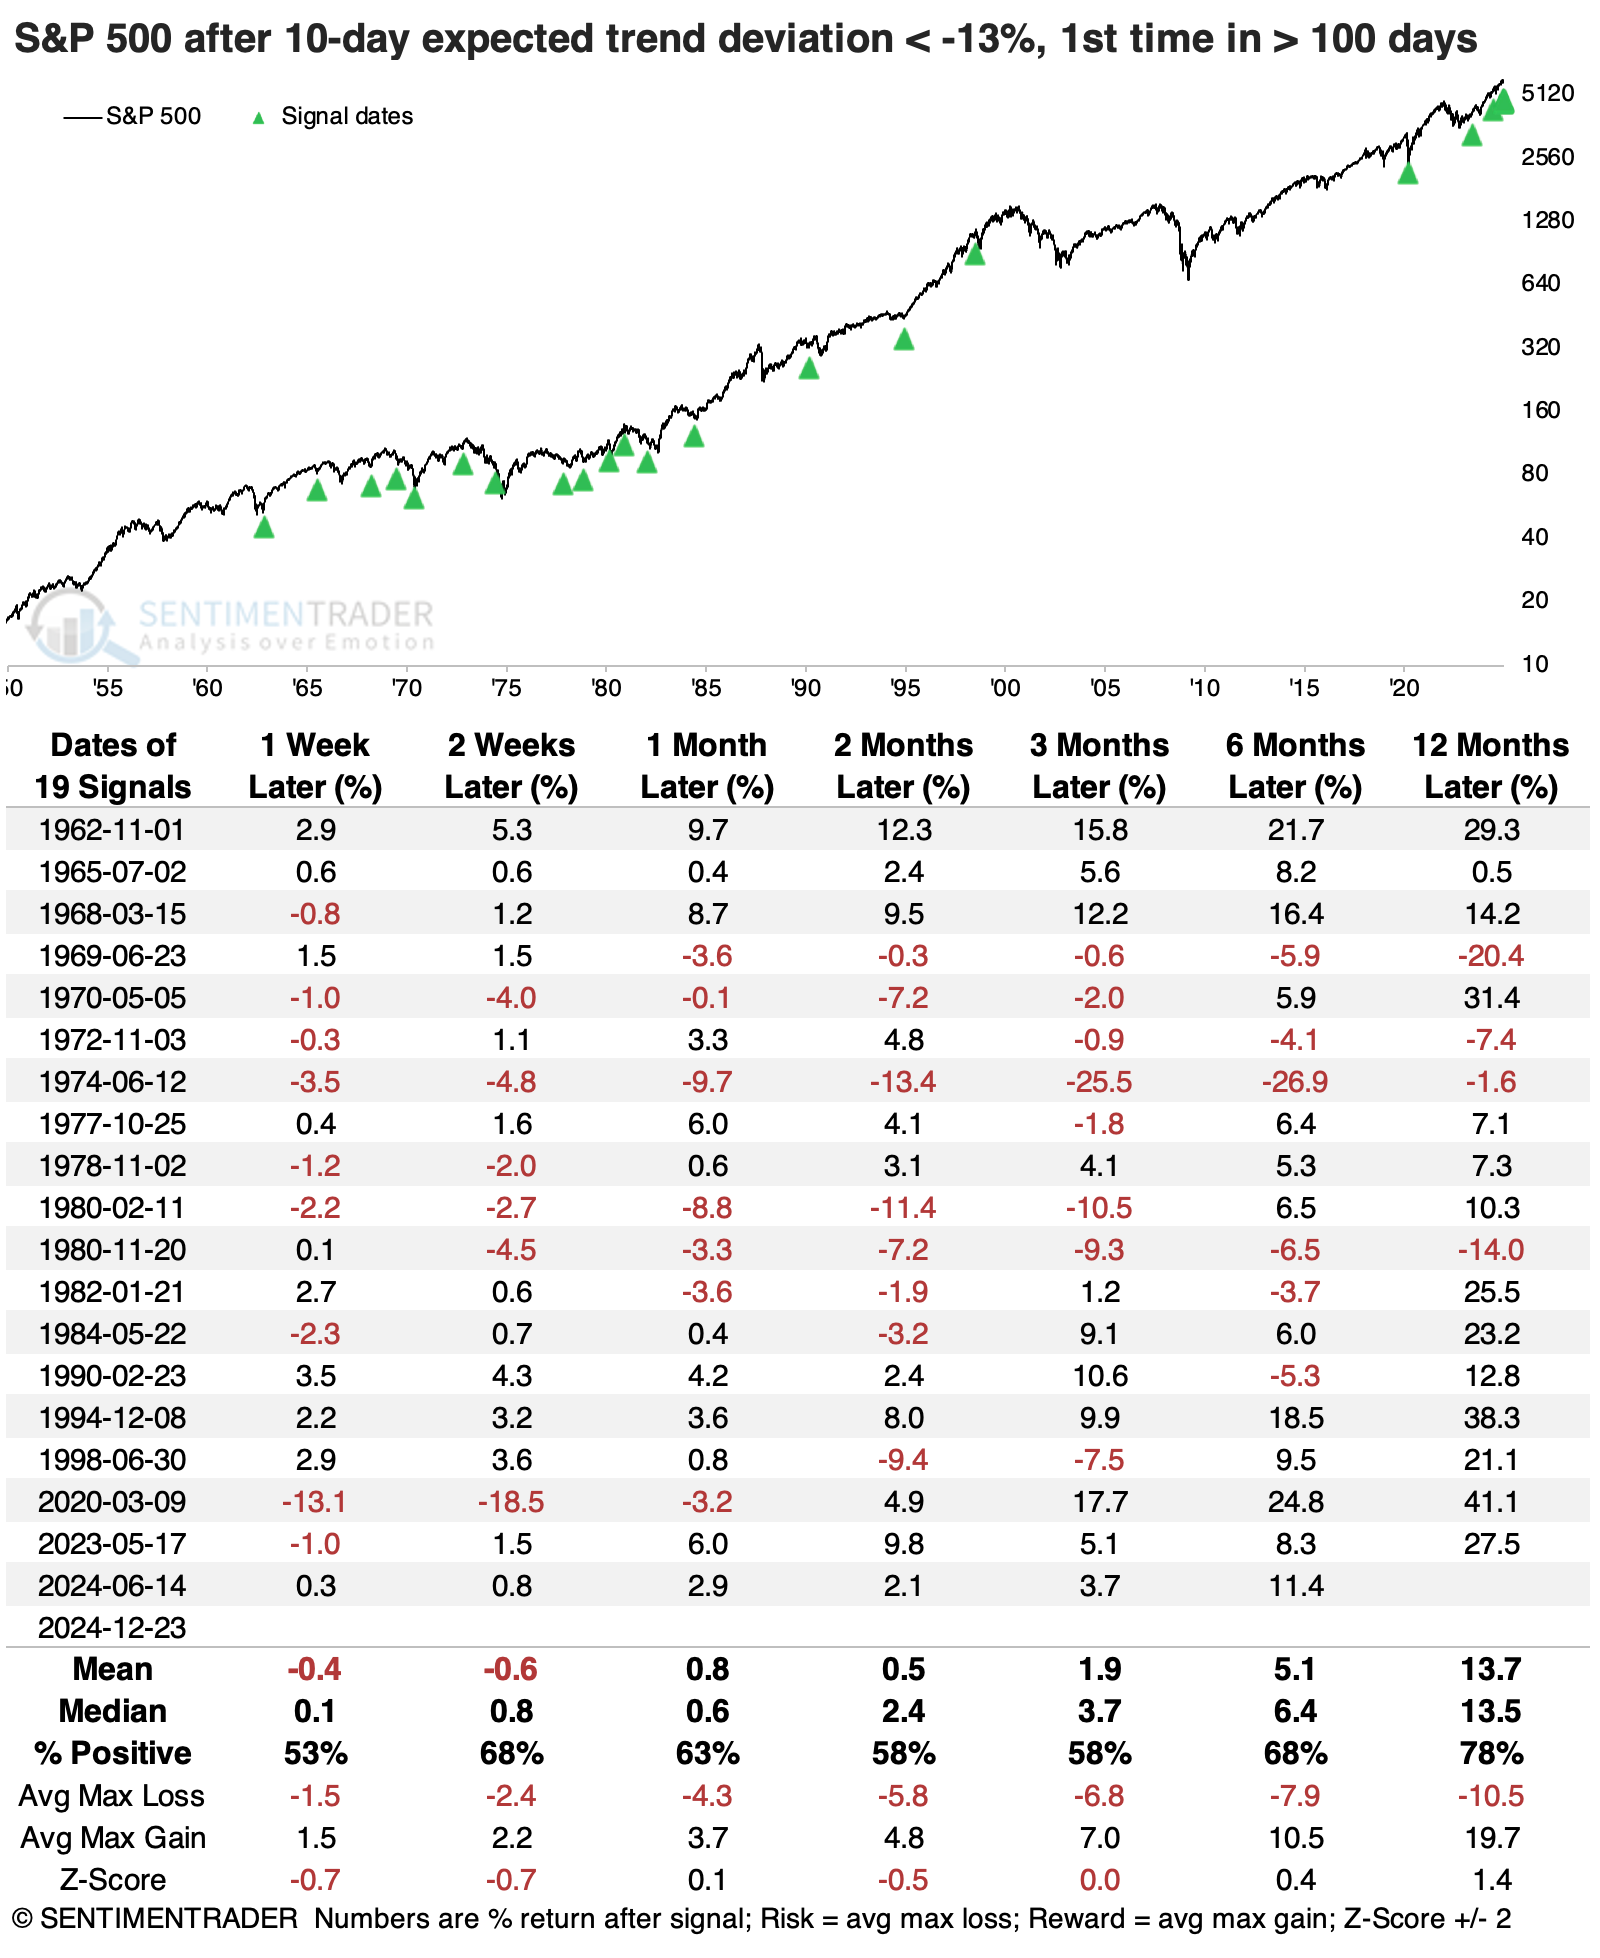
To smooth out some of the volatility, the table below shows the S&P's returns when a 10-day moving average of the spread falls below -13% for the first time in at least the past 100 sessions.
Short-term returns were mostly poor, but they improved slightly after that. Overall, the S&P's median returns were about in line with random, the win rate was a little bit worse than average, and the risk/reward ratio was mostly positive but weak. On the plus side, the signals over the past 40 years mainly preceded positive returns, with the few losses being moderate and quickly erased.
We might expect a defensive tilt to the better performers after these signals, but returns among factors were pretty evenly balanced.
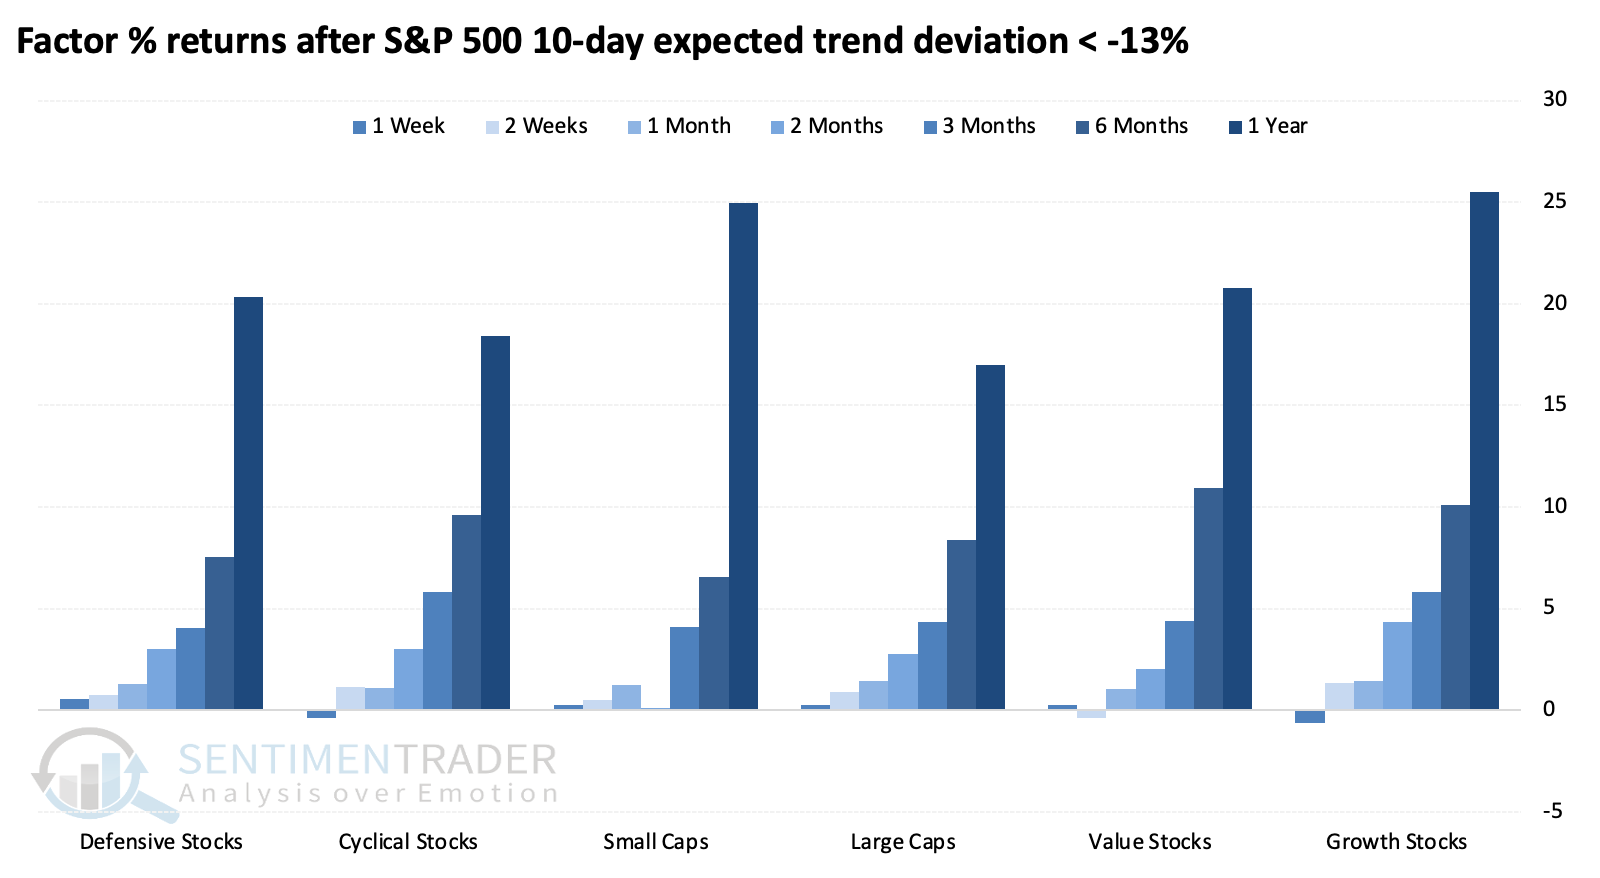
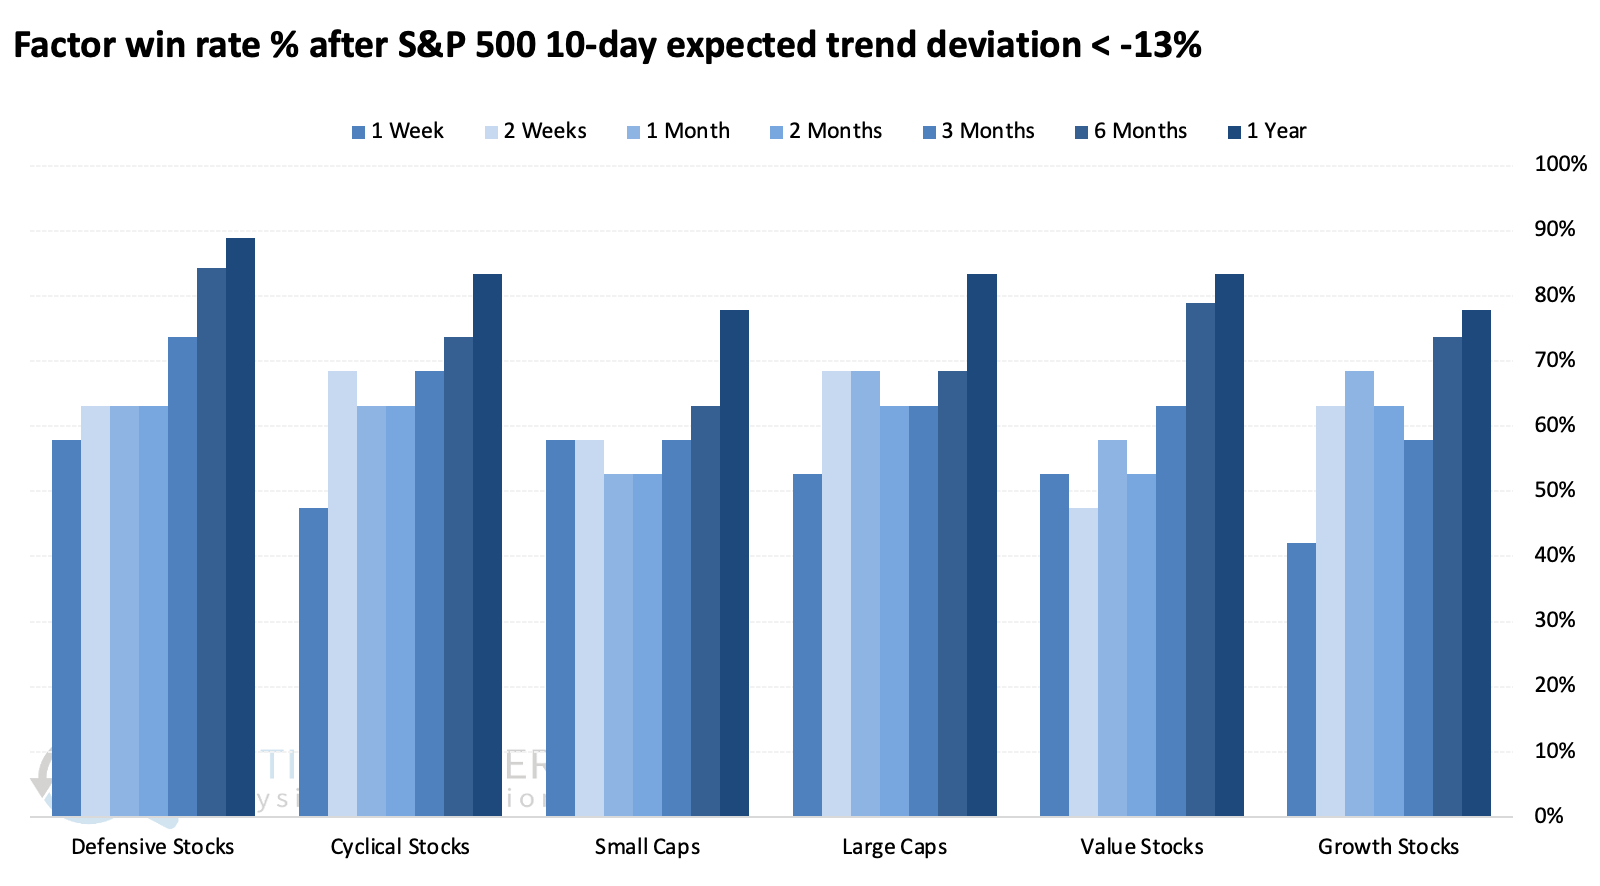
The one semi-notable difference among them was in the win rate. Defensive stocks showed the most consistent gains across time frames, culminating in a nearly 90% probability of being positive over the following year, while cyclical stocks were less likely to rise over longer time frames. There was also a modest edge toward value versus growth stocks, even though their median return was lower.
Maybe the big down days wrung some of the losses out
Over the past couple of sessions, stocks suffered unexpected losses. Well, "unexpected" in terms of seasonality - due to lower volumes and a generally positive outlook this time of year, it's not often that stocks suffer stiff losses near year-end.
The Santa Rally period is defined as the last five trading sessions of a year and the first two sessions of the new one. This is the first time since 2019 and only the ninth time since 1928 that the S&P 500 slid more than -1% on any two days during this seasonal period. The S&P rebounded every time but once in the weeks ahead, with the exception being during the global financial crisis.
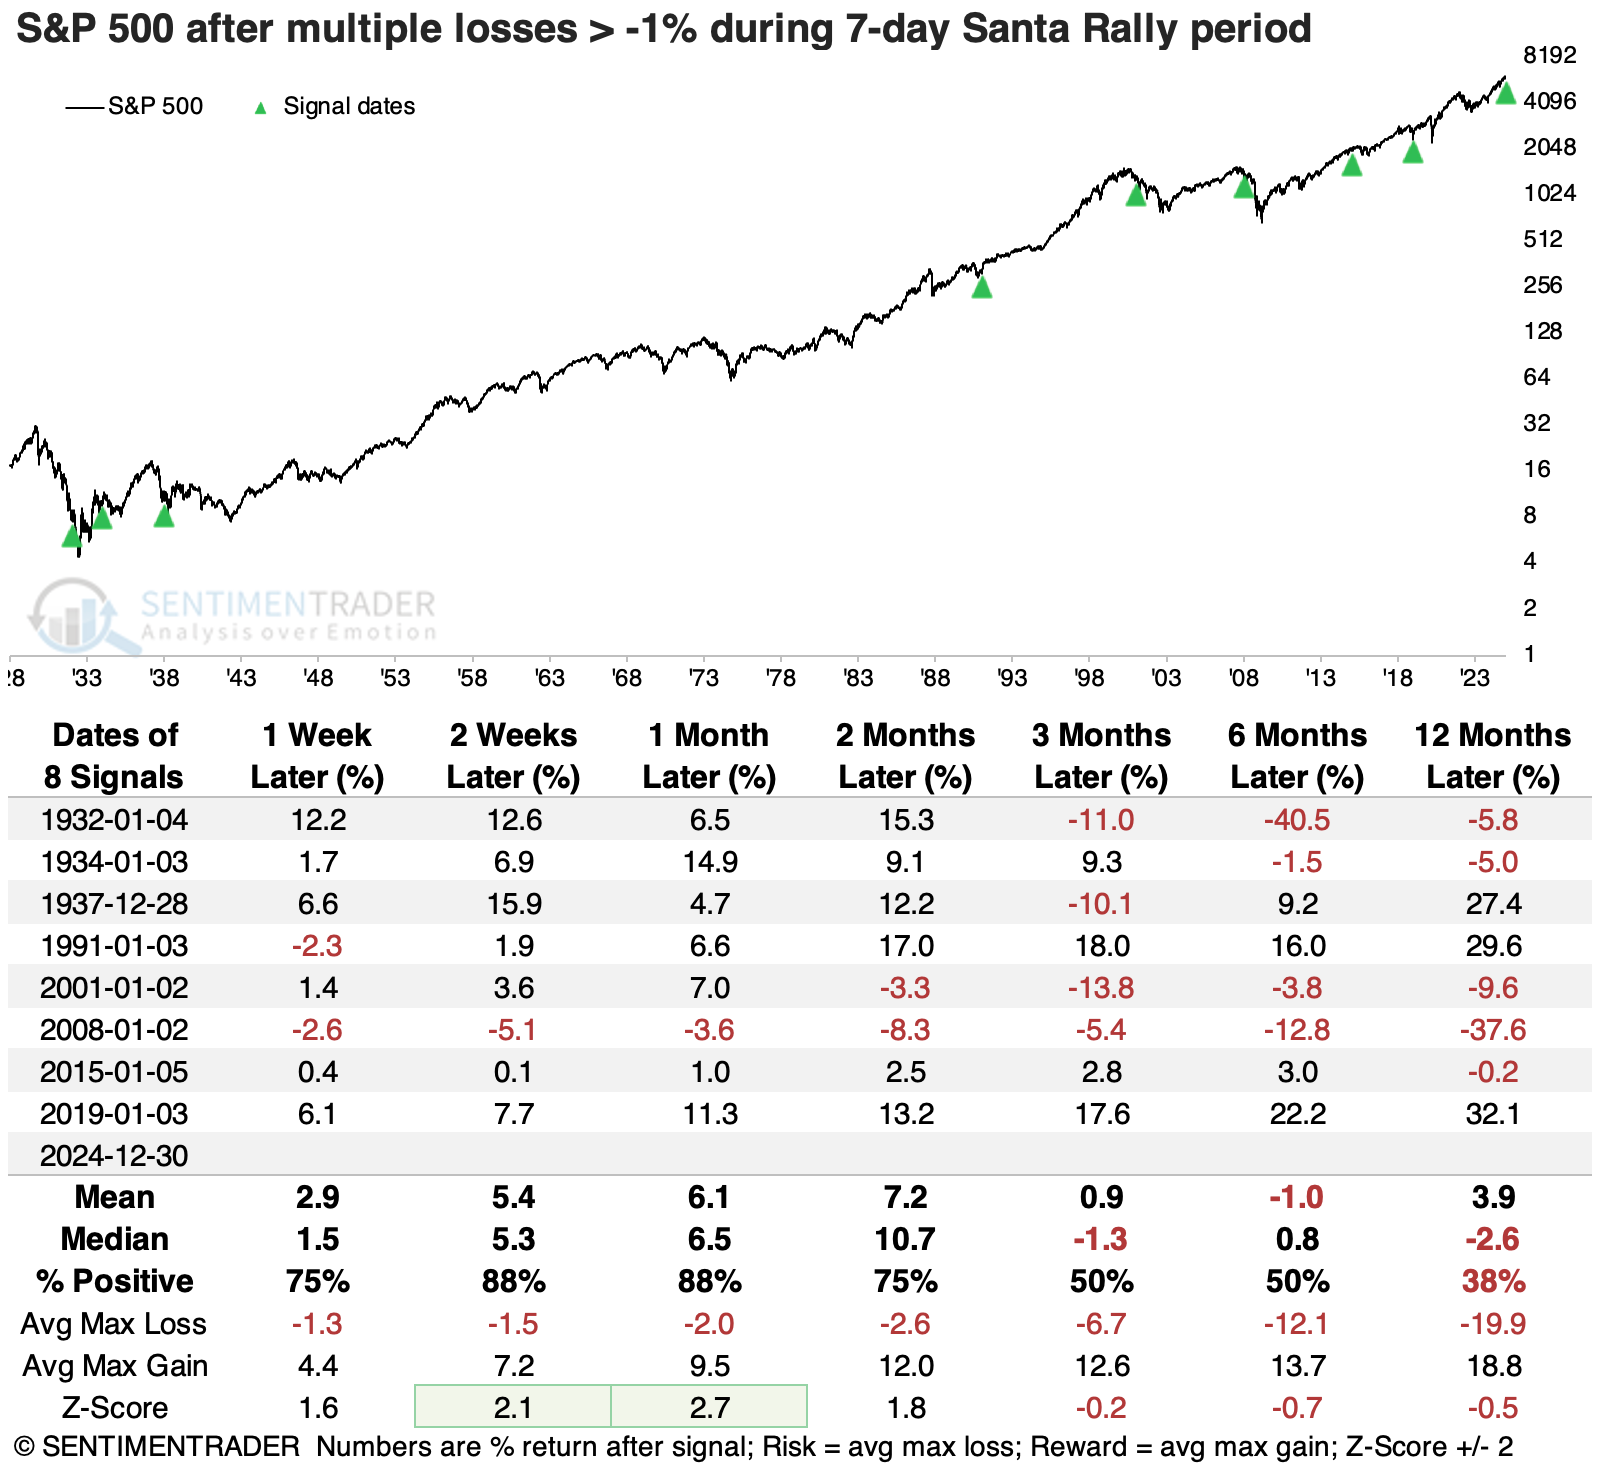
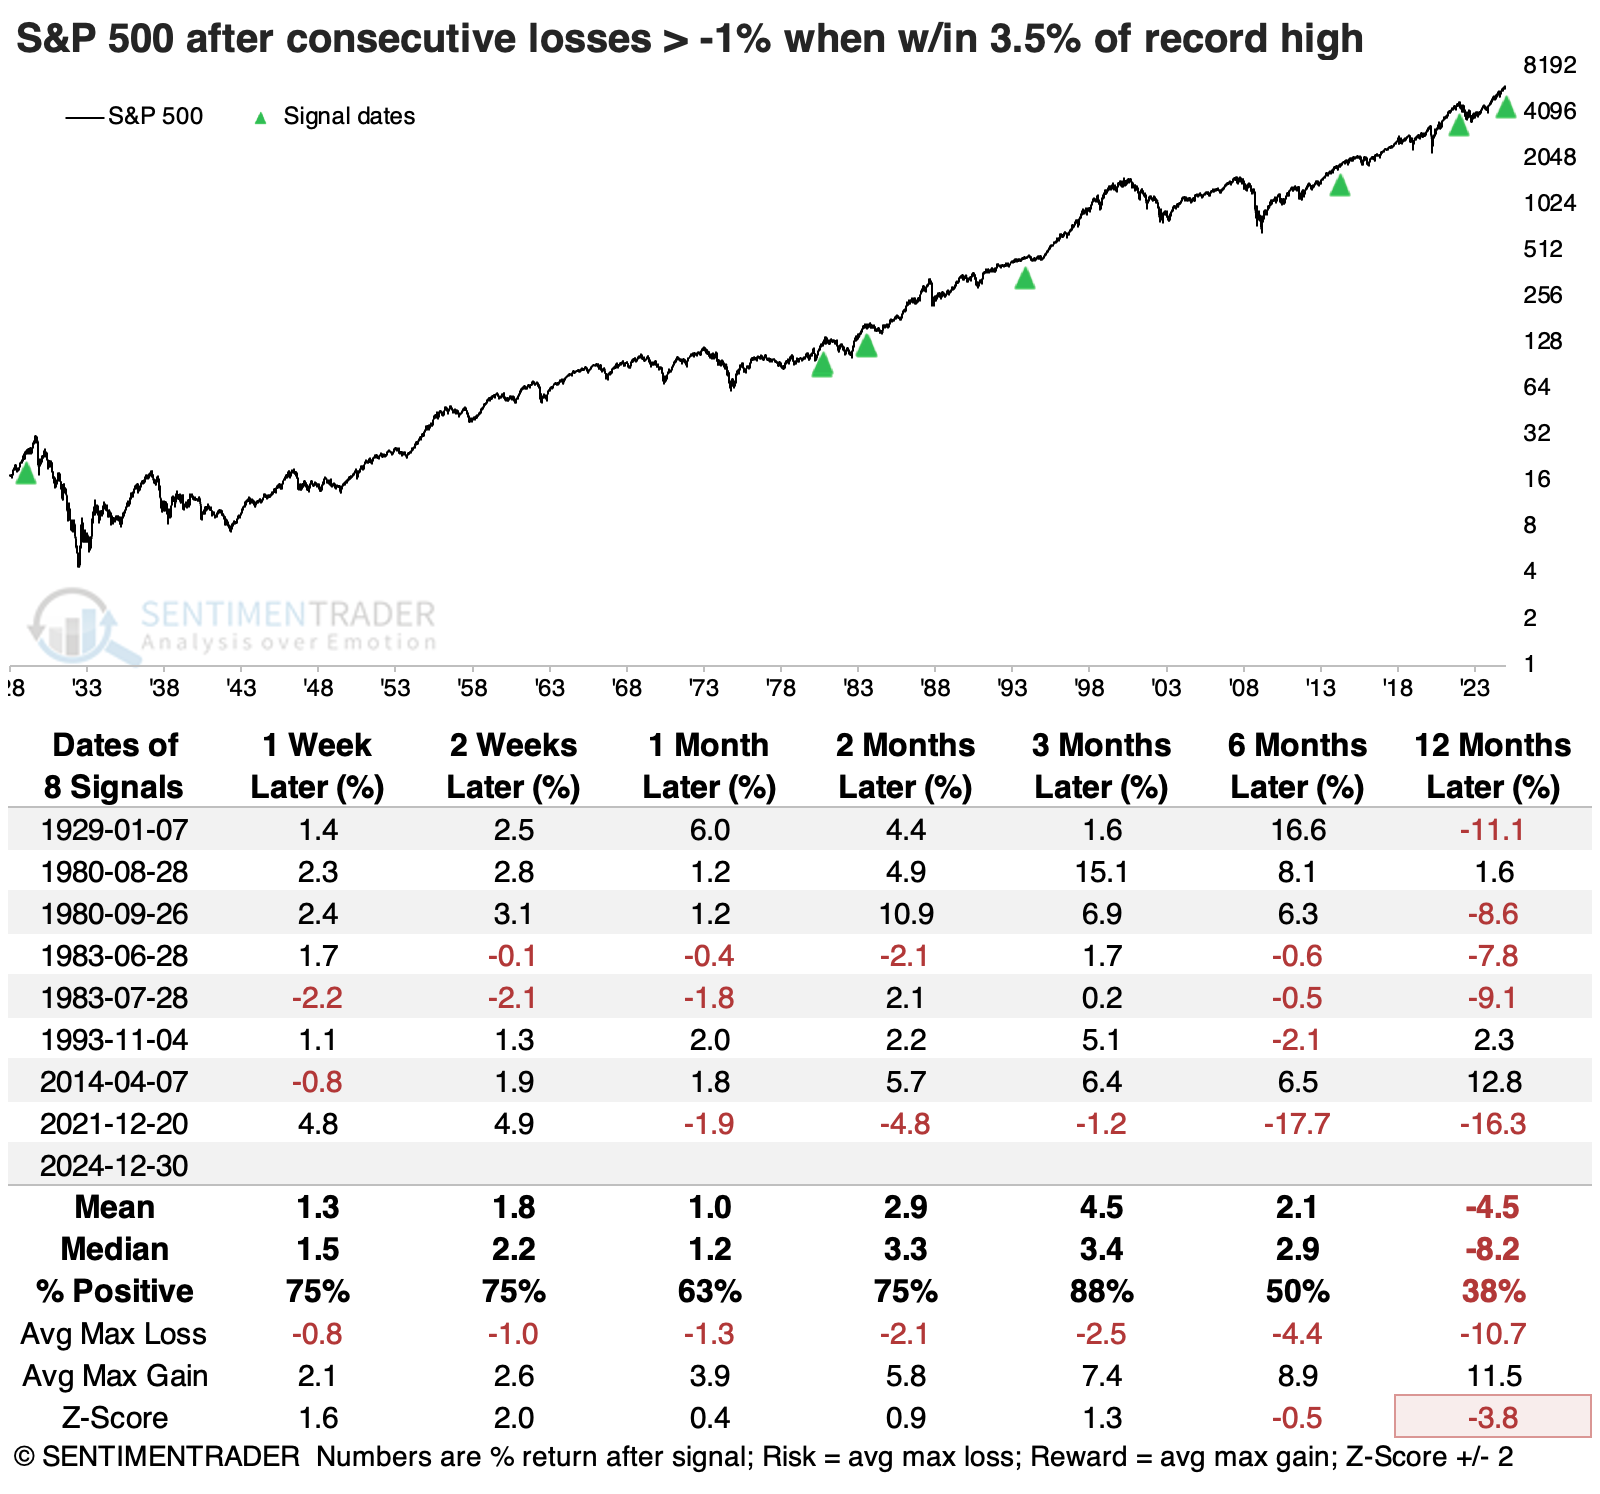
If we ignore the seasonal aspect and look at consecutive -1% losses while the S&P 500 was so close to a record high, a similar suggestion appears. The S&P rebounded over the following three months seven out of eight times it suffered large back-to-back losses within 3.5% of a record high.
Unfortunately, many of those gave back those gains and then some. One of those signals was triggered in late December 2021, which looks quite similar to the current price pattern. The S&P shot to a new record after its losing streak, then fell into the 2022 funk.
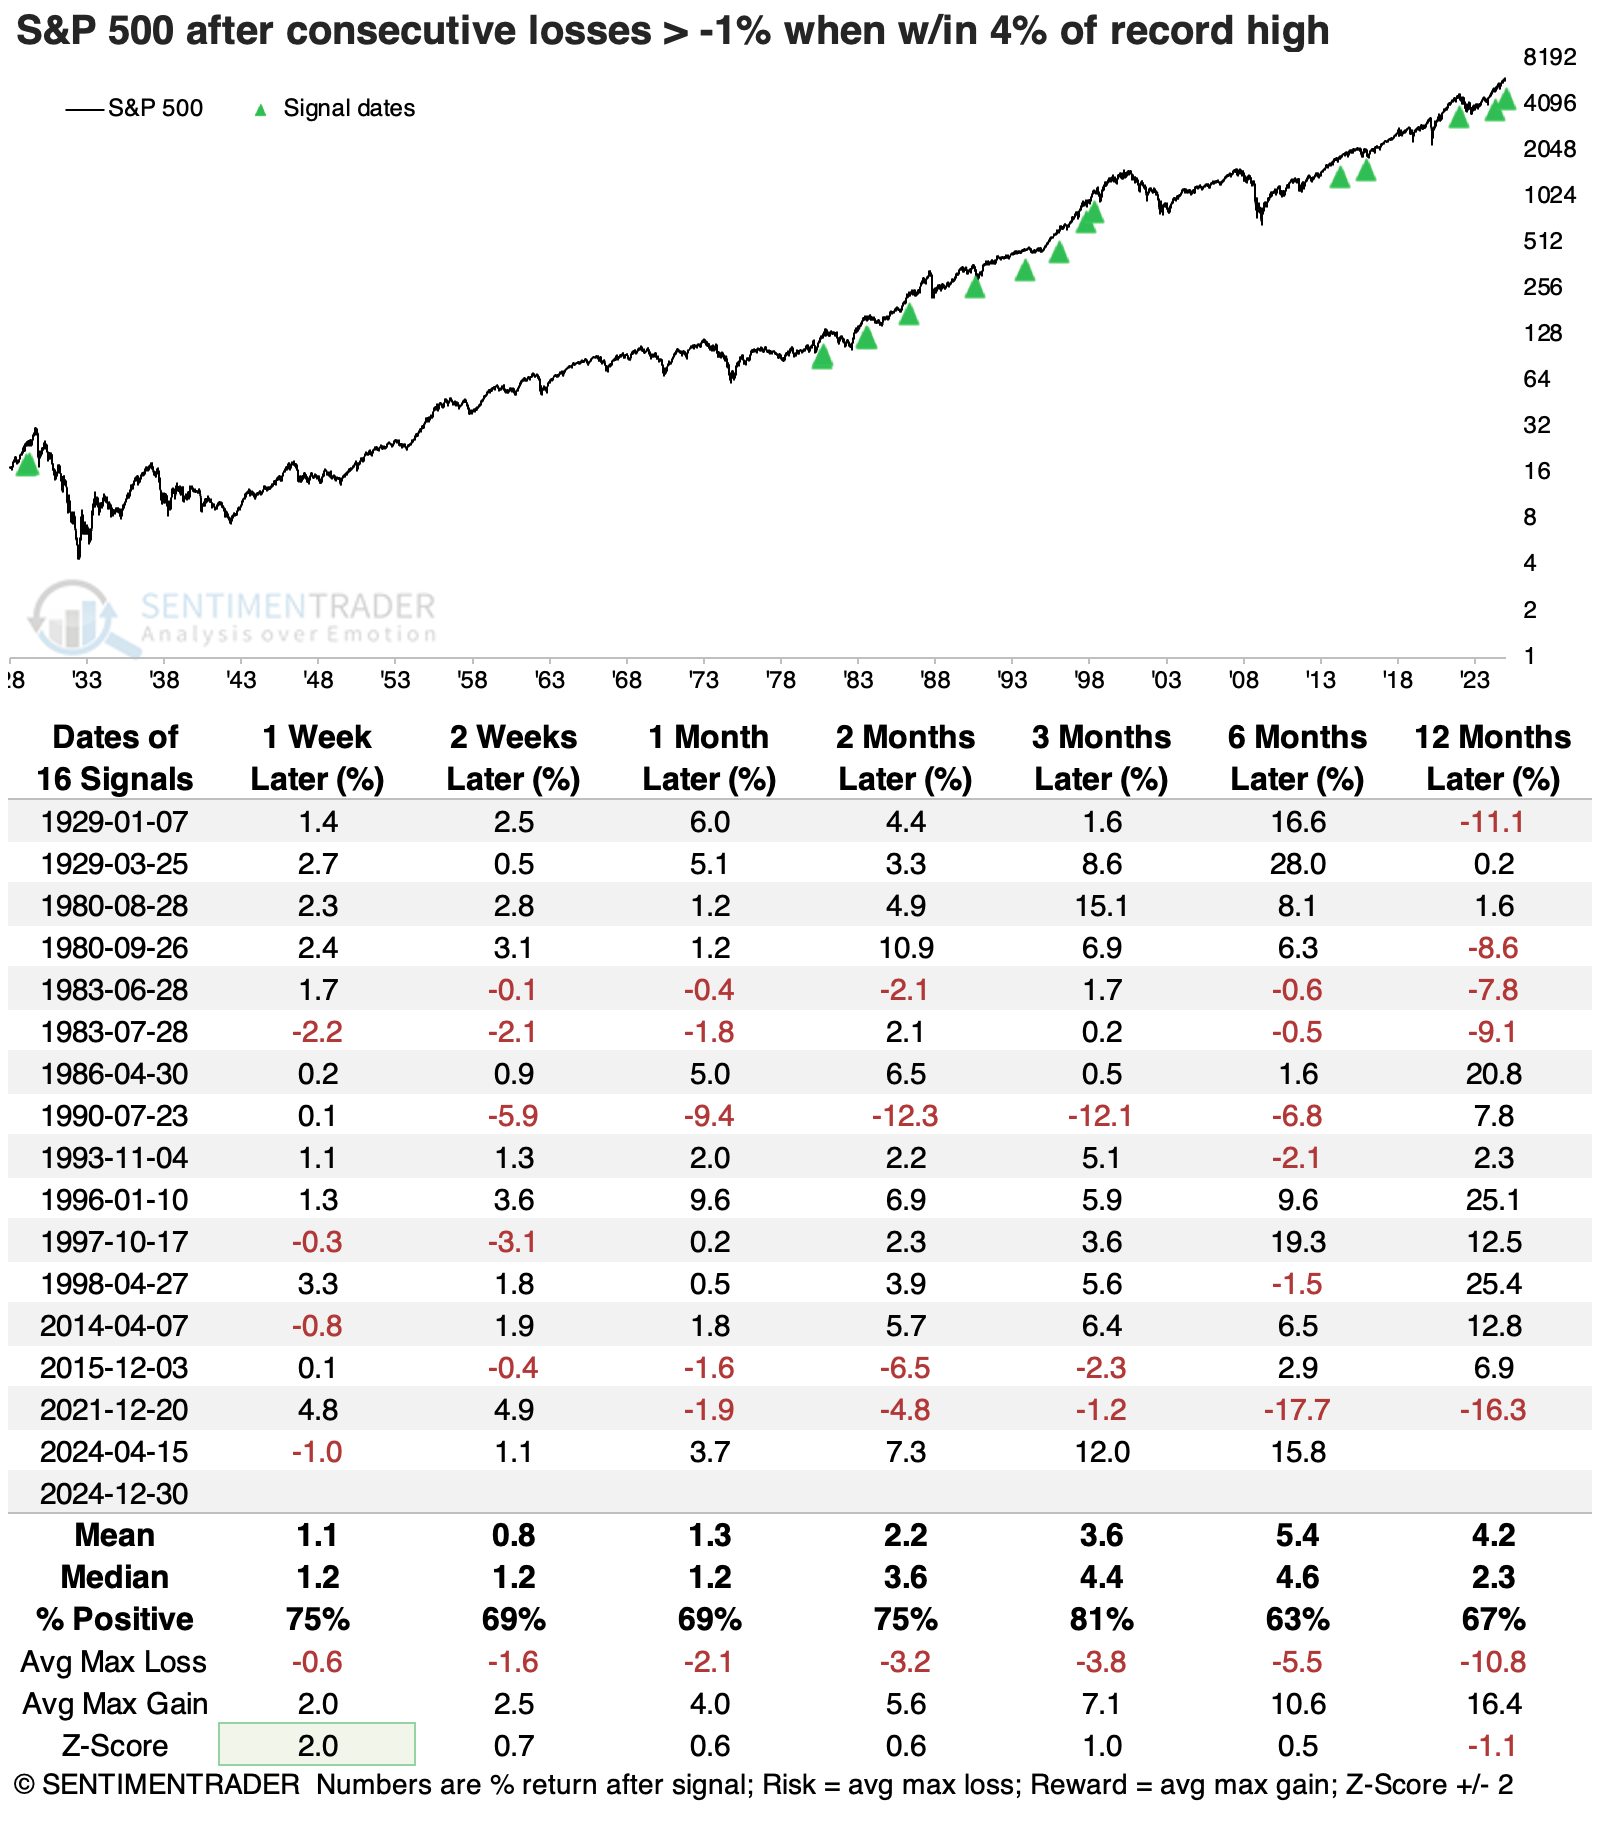
If we expand the pullback amount to within 4% of a high, the sample size doubles. Only two of these suffered meaningful losses over the next few months, alleviating some of the concerns from the table above.
What the research tells us...
Stocks can make odd and sudden moves around year-end, especially after a big year like 2024. Low volumes and tax considerations can significantly impact some stocks and even entire sectors; perhaps we're seeing some of that play out now.
Volatility has been higher than they typically see this time of year, with weeks of deterioration under the surface quickly scooped up on isolated days like last week. That makes it hard to get too pessimistic about the market environment because buyers are willing to step up when there is weakness. The session on Friday seemed to negate that, but it will take more than just a day to determine that sellers now have the upper hand.