
Stocks reversed lower last week, triggering several sell signals

Key points:
- The number of S&P 500 stocks above their 30-day avg cycled from > 74% to < 15% in 3 sessions
- After other signals, the S&P 500 showed flat to negative returns
- A Zweig thrust signal for NYSE issues that reverses the concept triggered a bearish alert
- After other signals, the S&P 500 showed negative returns
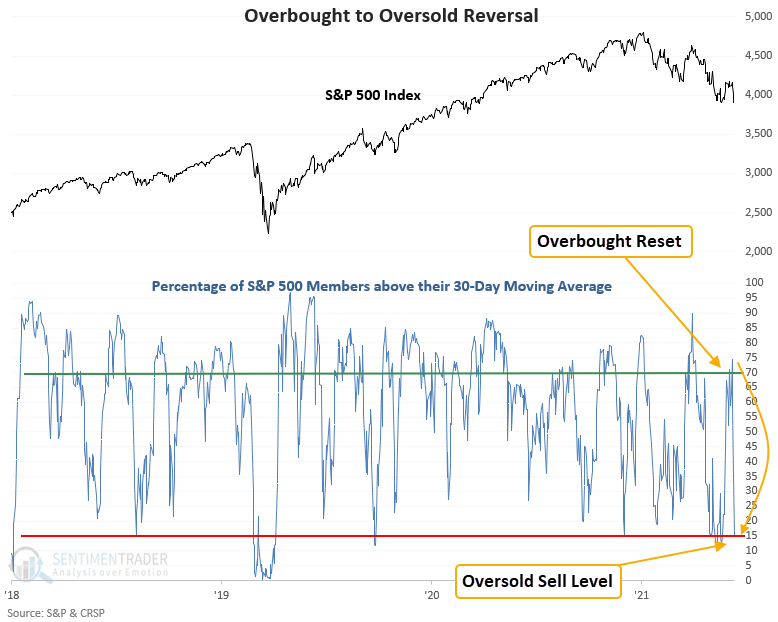
Medium-term trends for S&P 500 stocks reversed from overbought to oversold
The percentage of S&P 500 members trading above their respective 30-day moving average reversed from > 74% to < 15% in 3 sessions.
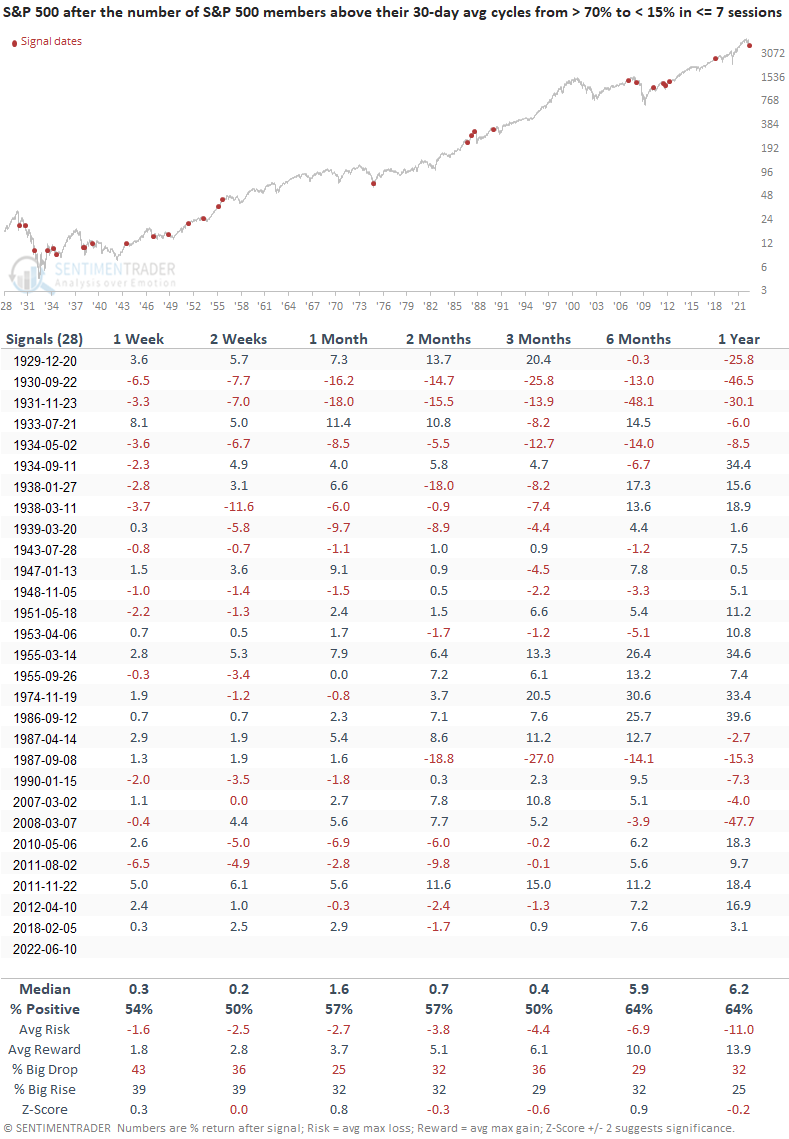
Let's study when the number of S&P 500 members trading above their respective 30-day moving average reverses from > 70% to < 15% in 7 sessions or fewer. I adjusted a few of the input parameters to increase the sample size.
Similar signals preceded flat returns over the next 3 months
This study generated a signal 28 other times over the past 93 years. After the others, the S&P 500 showed somewhat flat returns across short to medium-term time frames. Interestingly, most signals occurred during the 1929-49 secular bear period.
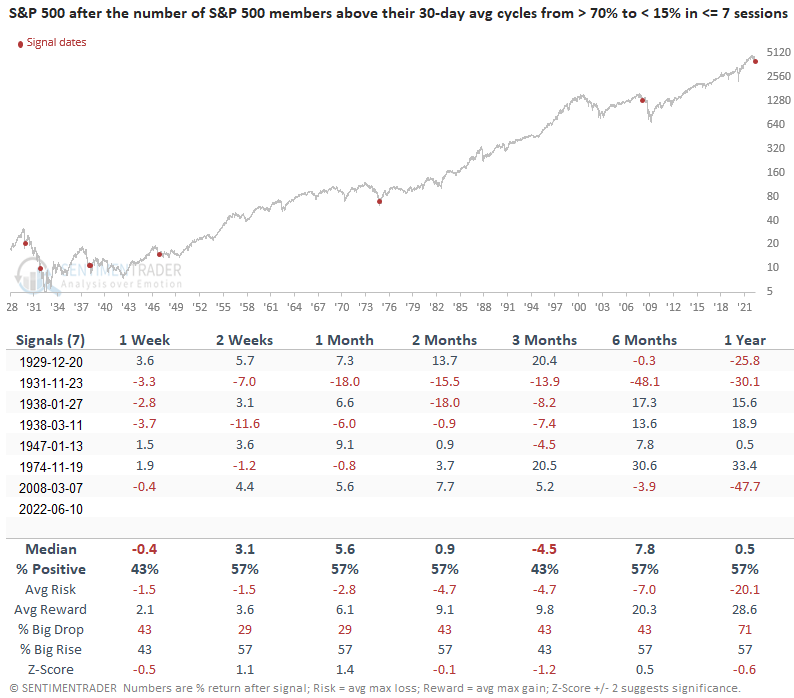
Signals that occurred when the S&P 500 had a declining 200-day average
If I isolate signals that occurred when the S&P 500 had a declining 200-day moving average for 35 consecutive days or more, which is the case now, the study generated 7 other signals. While the sample size is considerably smaller, the signals show a negative return at some point in the first 6 months in all instances. The 2008 alert occurred after a lower low and when the S&P 500 was flirting with a 20% decline, setting up a multi-month bounce.
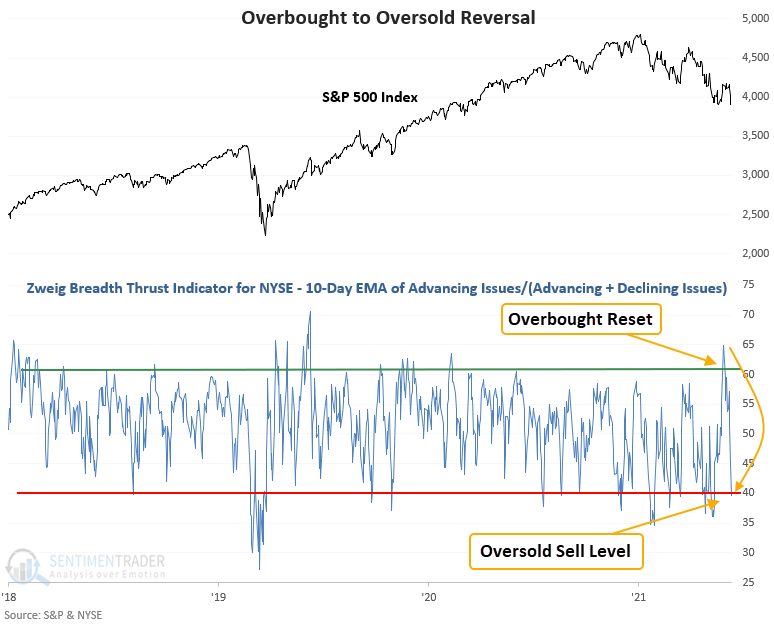
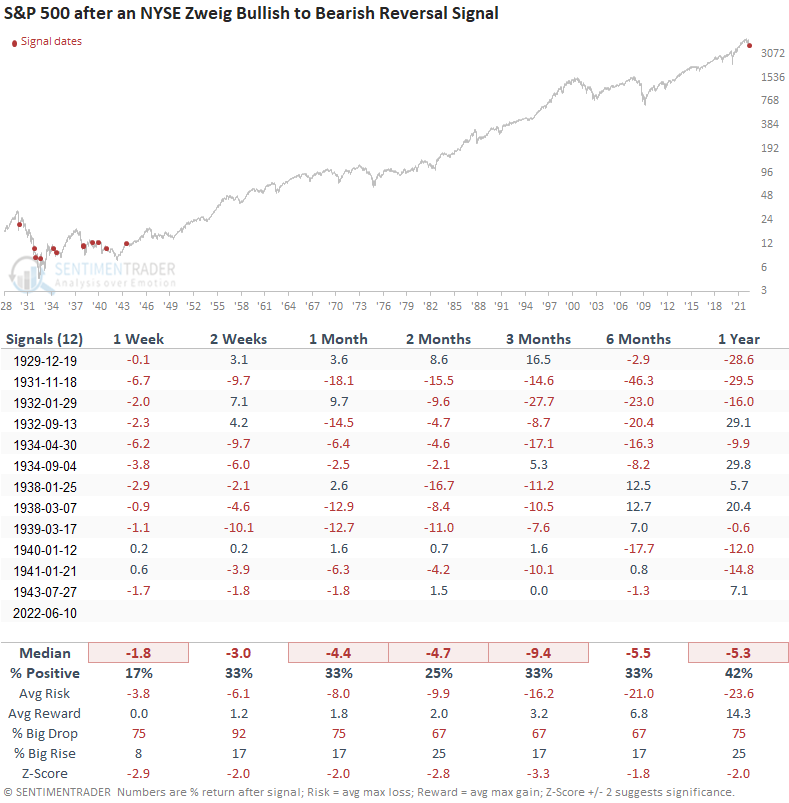
A Zweig thrust signal that reverses the concept triggers an alert
Martin Zweig created the Zweig Breadth Thrust, one of the more popular and influential breadth thrust buy signals. If you would like to learn more about the signal, please click here. One can reverse the concept whereby the model identifies instances when the indicator reverses from > 61.5% to < 40% in 10 sessions or fewer. A new alert for NYSE issues generated a signal at the close of trading on Friday. Let's assess the outlook for the S&P 500 after other instances. Credit to Rob Hanna for pointing out the new alert on social media.
Similar signals preceded negative returns for the S&P 500
This study generated a signal 12 other times over the past 93 years. After the others, the S&P 500 showed unfavorable returns, win rates, and z-scores across all time frames. Interestingly, previous signals occurred during the volatile 1929-42 secular bear market period. The significant gap between the last alert in 1943 and now is something to be kept in mind.
What the research tells us...
When S&P 500 members trading above their respective 30-day average reverses from overbought to oversold in a few sessions, the negative momentum begets more negative momentum. Similar setups to what we're seeing now have preceded flat to negative returns for the S&P 500, especially when the 200-day moving average is declining. The Zweig breadth thrust indicator for NYSE issues reversed from overbought to oversold in 10 sessions or fewer, triggering a negative momentum signal for a significantly broader basket of stocks. Similar Zweig setups resulted in unfavorable returns, win rates, and z-scores across all time frames. I would note the rarity of the signal, which hasn't occurred since 1943. We remain in a sell-the-rip environment until proven otherwise.