Products
SentimenTrader Trading Tools
‍
Backtest Engine
My Trading Toolkit
Correlation Analysis
Seasonality
Market Prediction
Indicators & Data API
‍
Proprietary Indicators & Charts
Market Data API
Strategies & Scanner
‍
50+ Trading Strategies
Smart Stock Scanner
Smart Option Scanner
Research Reports
‍
Research Solutions
Reports Library
Free Resources
Simple Backtest Calculator
Simple Seasonality Calculator
The Kelly Criterion Calculator
Sentiment Geo Map
Public Research Reports
Education
Sentiment Indicators
Technical Indicators
Pricing
Company
About
In the News
Testimonials
Client Success Stories
Contact
Log inLoginSign up
< BACK TO ALL REPORTS

Stocks Haven't Done This for More Than 6 Months

Jason Goepfert
2021-05-20
The S&P 500 has gone more than 6 months without a 5% pullback from a high, a historically long stretch since 1928.

The bears tried. They failed but seem to be making another run today.

After letting some air out of Tech stocks and some former highfliers, bulls have made a stand and kept the broader market steady. Once again, sellers failed to push the S&P 500 down even 5% from its peak. It got close last week but held above that threshold.

S&P 500 drawdown less than 5%

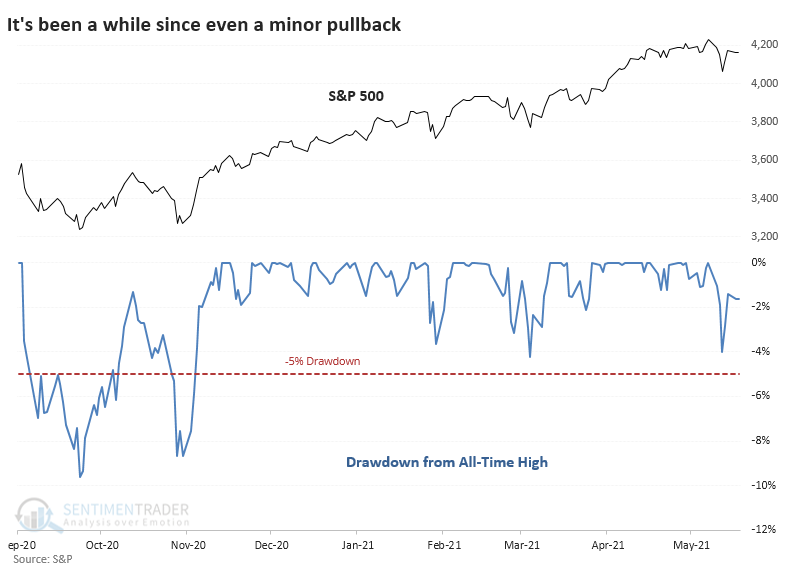
The index has now gone 134 trading days without a 5% pullback. That's the 18th-longest streak since 1928, and it would take only a few more days to push it into 15th place. 

Once it got this extended, the S&P's returns over the next month were poor. Even up to 3 months later, its risk outweighed its reward. But as we've seen with so many momentum studies, when buyers have been so persistent, they didn't give up easily, and there were few large declines to speak of. 

The Risk/Reward table highlights those signals when the index fell more than 10% from the signal date. Only 2 out of the 17 signals suffered that fate within the first 3 months.

Stat Box

Thanks to the uptick in gold, 94% of gold mining stocks recently traded above their 50-day moving averages. That's the most since August 10th of last year. Our Backtest Engine, which goes back to 1993 for breadth on gold mining stocks, shows a flat 6-month return in the Gold Bugs index when so many stocks were above their 50-day averages.


What else we're looking at

  • Full details following 134 days without a 5% pullback
  • What happens when the Technology sector is leading to the downside
  • Inflation is becoming more of an issue - what that's meant for Technology stocks
  • Looking at a new Risk Off Composite Model and where it stands today
PRODUCTS
SentimenTrader
Trading Tools
Indicators & Data API
‍
Strategies & Scanner
‍
Research Reports
FREE
RESOUrCES
Simple Backtest
Calculator
Simple Seasonality
Calculator
The Kelly Criterion
Calculator
Sentiment Geo Map
‍
Public Research Reports
‍
Education
Sentiment Indicators
‍
Technical Indicators
‍
Pricing
Bundle pricing
‍
FAQ
‍
Announcements
‍
COMPANY
‍
About
‍
In the News
‍
Testimonials
‍
Client Success Stories
CONTACT
‍
General Inquiries
‍
Media Inquiries
‍
Financial Professionals Inquiries
‍
© 2026 Sundial Capital Research Inc. All rights reserved.
Setsail Marketing
TermsPrivacyAffiliate Program
Risk Disclosure: The information and tools provided are for research and analytical purposes only and are not intended as investment advice. Market analysis involves uncertainty, and outcomes may differ from expectations. Users should conduct their own due diligence and consider their individual circumstances before making any financial decisions. Past performance is not necessarily indicative of future results.

Hypothetical Performance Disclosure: Hypothetical performance results have many inherent limitations, some of which are described below. No representation is being made that any account will or is likely to achieve profits or losses similar to those shown; in fact, there are frequently sharp differences between hypothetical performance results and the actual results subsequently achieved by any particular trading program. One of the limitations of hypothetical performance results is that they are generally prepared with the benefit of hindsight. In addition, hypothetical trading does not involve financial risk, and no hypothetical trading record can completely account for the impact of financial risk of actual trading. for example, the ability to withstand losses or to adhere to a particular trading program in spite of trading losses are material points which can also adversely affect actual trading results. There are numerous other factors related to the markets in general or to the implementation of any specific trading program which cannot be fully accounted for in the preparation of hypothetical performance results and all which can adversely affect trading results.

Testimonial Disclosure: Testimonials appearing on this website may not be representative of other clients or customers and is not a guarantee of future performance or success.