Data & Technology
Research Reports
Report Solutions
Reports Library
Actionable StrategiesPricingCompanyContact
Log inLoginSign up
< BACK TO ALL REPORTS

Stocks have been trapped between time frames

Jason Goepfert
2020-05-22
The S&P 500 has been stuck in a range for a month, above its medium-term 50-day moving average but below its long-term 200-day average. Based on other long streaks of being stuck between time frames, there has been a higher likelihood it will break the streak by falling below its 50-day average. But future returns were weak, no matter which way it broke.

We're stuck in post-panic churn, and the most benchmarked index in the world can't seem to get over the hump.

On Thursday, we saw that the S&P 500 hasn't been able to mount its 200-day average despite approaching it 3 weeks ago. And yet, it's still been able to hold above its rising 50-day average, which caused some to question which time frame will win out. Is it more likely for stocks to fail and fall below the 50-day average, or succeed and break out above the 200-day?

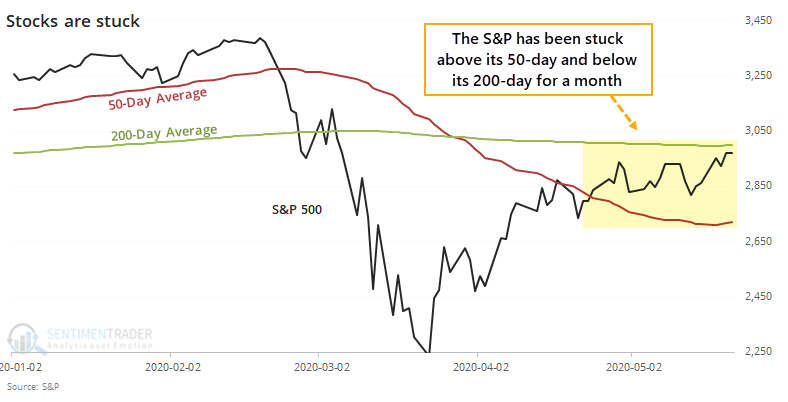
Now that its streak of being stuck has reached 20 days, it's one of the longer battles between time frames since 1928.

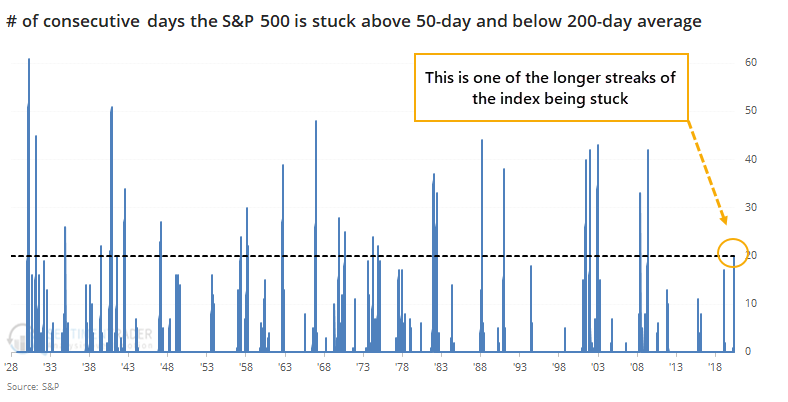
There have been 29 streaks that reached 20 days. Of those, 21 saw the streak end when the S&P fell below its 50-day average. Only 8 ended by the S&P rising above its 200-day average. So we could make the suggestion that there's about a 72% probability the index will break down.

It probably doesn't matter.

Below, we can see every time the S&P was stuck above its 50-day and below its 200-day for 20 consecutive sessions.

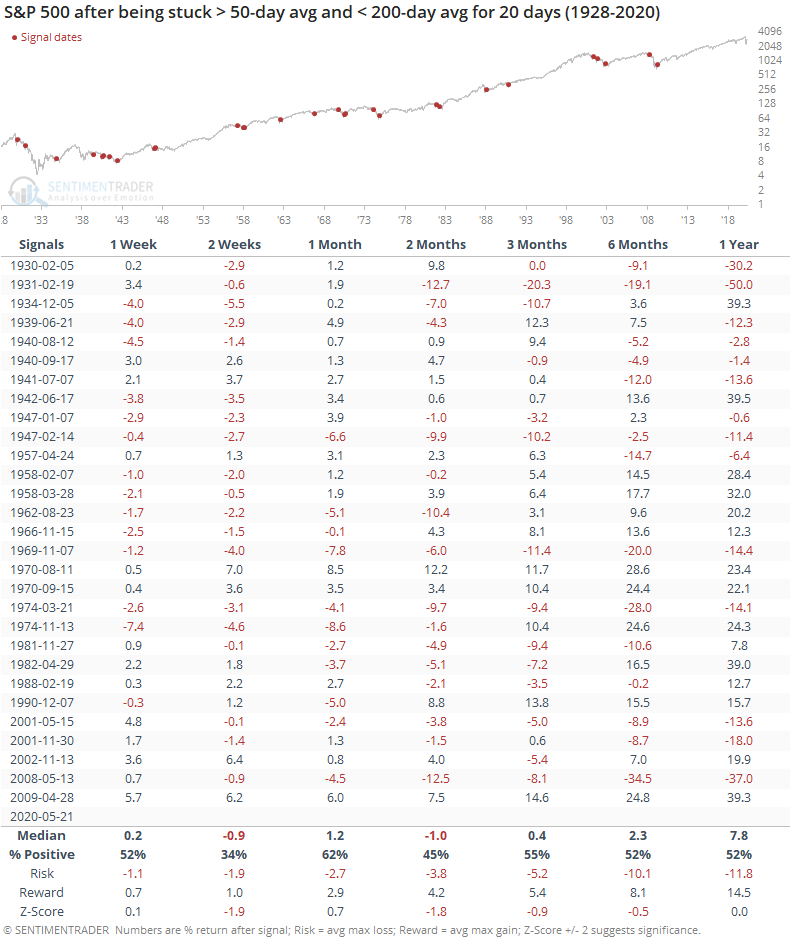
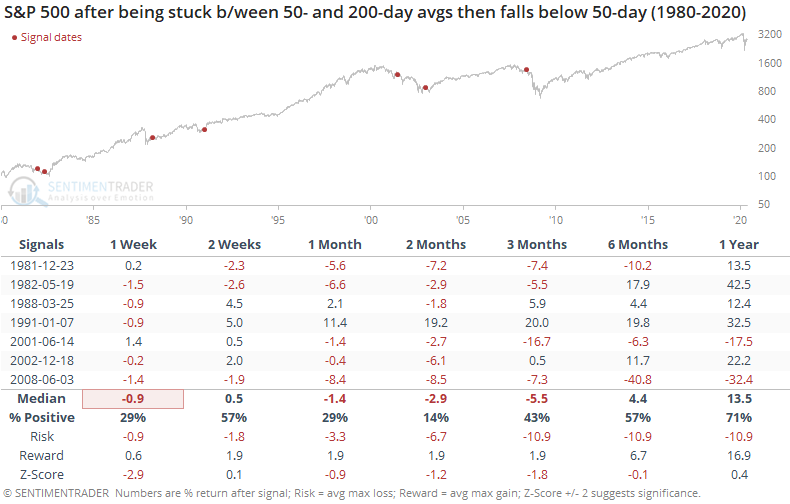
Like we saw on Thursday, when the index gets stuck below its long-term average, it has tended to resolve lower in the weeks ahead. Because of that, as noted above, there is a higher likelihood it will end the streak by falling below its 50-day average.

Here is how it performed after doing so:

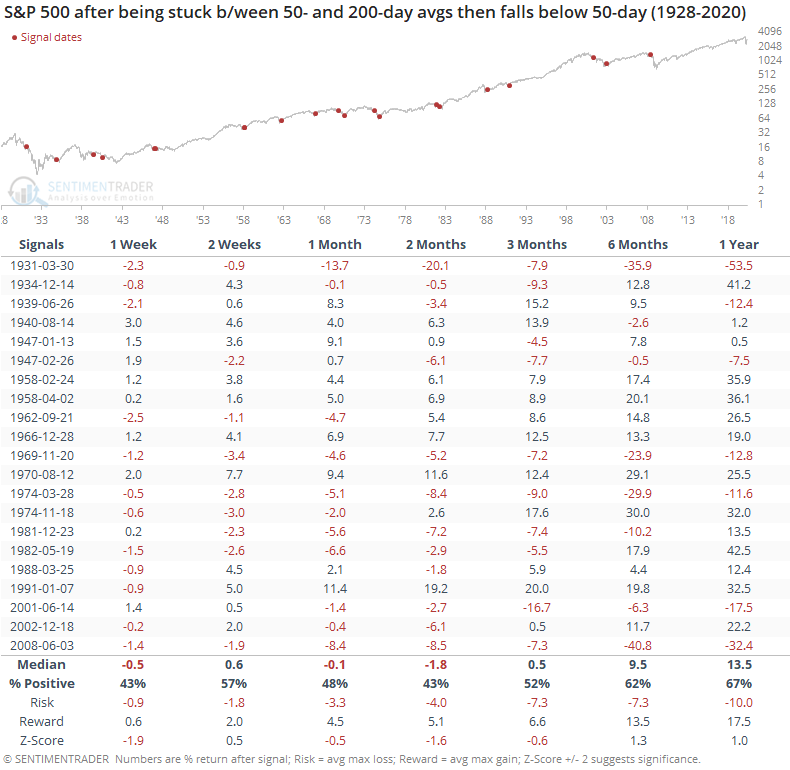
Again, the returns were poor, especially over the next two months. It has been an extremely bad sign over the past 40 years. Only one of the failures managed to quickly right itself and head higher, which ended up being a great sign for the longer-term.

So what about if the index breakouts out to the upside instead? Well, that wasn't great, either. 

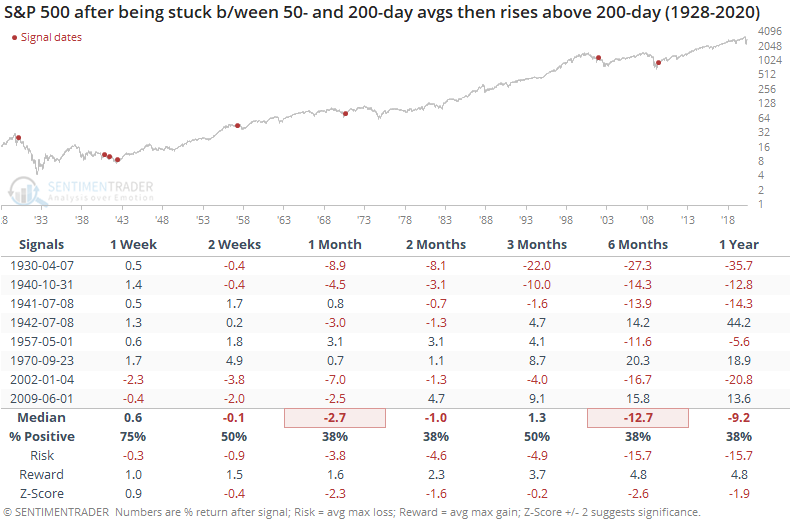
It's kind of a no-win situation. If the S&P broke down below its 50-day, then returns were bad (and terrible in recent decades). If it broke out to the upside, then returns were limited across almost all time frames, with really only one exception in 1970. All of the others either saw losses in the month(s) ahead or failed rallies.

The trouble is basically that buyers haven't shown enough oomph to make any progress lately. When that happens during downtrending markets like we've been in, with a protracted stretch near but below the 200-day average, it has indicated larger problems and that has almost always meant further weakness ahead.

Sorry, this content is restricted to SentimenTrader members.

To read this post, please login to your account, sign up for our trading solutions or start a 30-day free trial.
LoginStart your 30-day free trial
DATA & TECH
IndicatorEdge
‍
BackTest Engine
‍
DataEdge API
REPORTS
Research Solution
‍
Reports Library
‍
Strategies
Index Trading Strategies
AI Stock Scanner
‍
PortfolioEdge
About us
Meet our Experts
‍
In the News
‍
Testimonials
Pricing
Bundle pricing
Subscribe to SentimenTrader's free newsletter
Get weekly highlights from our expert analysis, product updates, exclusive promotions, and invaluable educational content straight to your inbox. Sign up today and elevate your investing knowledge.
Thank you! Your submission has been received!
Oops! Something went wrong while submitting the form.
© 2023 Sundial Capital Research Inc. All rights reserved.
TermsPrivacy
Risk Disclosure: Futures and forex trading contains substantial risk and is not for every investor. An investor could potentially lose all or more than the initial investment. Risk capital is money that can be lost without jeopardizing ones’ financial security or life style. Only risk capital should be used for trading and only those with sufficient risk capital should consider trading. Past performance is not necessarily indicative of future results.

Hypothetical Performance Disclosure: Hypothetical performance results have many inherent limitations, some of which are described below. No representation is being made that any account will or is likely to achieve profits or losses similar to those shown; in fact, there are frequently sharp differences between hypothetical performance results and the actual results subsequently achieved by any particular trading program. One of the limitations of hypothetical performance results is that they are generally prepared with the benefit of hindsight. In addition, hypothetical trading does not involve financial risk, and no hypothetical trading record can completely account for the impact of financial risk of actual trading. for example, the ability to withstand losses or to adhere to a particular trading program in spite of trading losses are material points which can also adversely affect actual trading results. There are numerous other factors related to the markets in general or to the implementation of any specific trading program which cannot be fully accounted for in the preparation of hypothetical performance results and all which can adversely affect trading results.

Testimonial Disclosure: Testimonials appearing on this website may not be representative of other clients or customers and is not a guarantee of future performance or success.