Products
SentimenTrader Trading Tools
‍
Backtest Engine
My Trading Toolkit
Correlation Analysis
Seasonality
Market Prediction
Indicators & Data API
‍
Proprietary Indicators & Charts
Market Data API
Strategies & Scanner
‍
50+ Trading Strategies
Smart Stock Scanner
Smart Option Scanner
Research Reports
‍
Research Solutions
Reports Library
Free Resources
Simple Backtest Calculator
Simple Seasonality Calculator
The Kelly Criterion Calculator
Sentiment Geo Map
Public Research Reports
Education
Sentiment Indicators
Technical Indicators
Pricing
Company
About
In the News
Testimonials
Client Success Stories
Contact
Log inLoginSign up
< BACK TO ALL REPORTS

Stocks Close Poorly As Smart Money Leaves Amid Tighter Conditions

Jason Goepfert
2018-03-25
null

This is an abridged version of our Daily Report.

Ramp Capital has folded

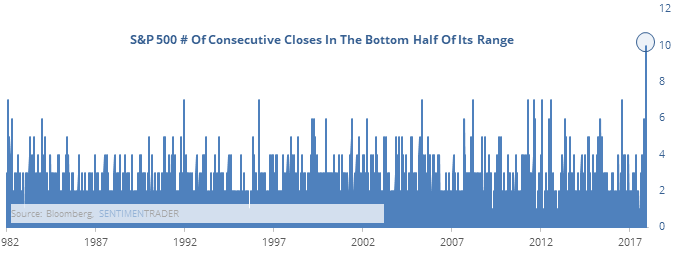
Last year, stocks routinely closed in the upper end of the day’s trading range, but that has drastically changed. Over the past two weeks, the S&P 500 has closed in the bottom half of its range every day, a new record.


The smart money is leaving

An index that looks at when traders are buying vs selling has plunged to new lows, similar to 2000 and 2008. Divergences between the index and the S&P 500 have led to mostly poor returns and risk/reward ratio.


Getting tighter

Financial conditions are getting tighter, one of the few times since 2017 that investors have faced this condition.

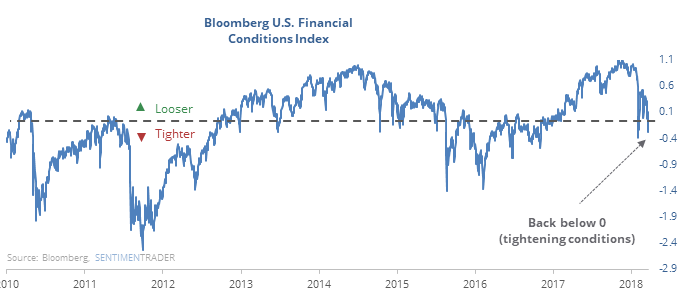
Stocks had a negative return during tightening financial conditions, though it has not worked well as a buy/sell signal.


The (almost) end of a long streak

The S&P 500 is within spitting distance of its 200-day average, which would end a streak of more than 400 days above. Its returns when below its average are poor, and the risk/reward going forward is not good.


Big drops

While the S&P is close to losing its 200-day average, it hasn’t yet, despite back-to-back losses of more than -2%. This is the first time since 1997 the S&P has suffered such large consecutive losses while still being in an uptrend.

For access to the full report, indicators, charts, screens, and Backtest Engine, log in or sign up for a free 30-day trial today.

PRODUCTS
SentimenTrader
Trading Tools
Indicators & Data API
‍
Strategies & Scanner
‍
Research Reports
FREE
RESOUrCES
Simple Backtest
Calculator
Simple Seasonality
Calculator
The Kelly Criterion
Calculator
Sentiment Geo Map
‍
Public Research Reports
‍
Education
Sentiment Indicators
‍
Technical Indicators
‍
Pricing
Bundle pricing
‍
FAQ
‍
Announcements
‍
COMPANY
‍
About
‍
In the News
‍
Testimonials
‍
Client Success Stories
CONTACT
‍
General Inquiries
‍
Media Inquiries
‍
Financial Professionals Inquiries
‍
© 2026 Sundial Capital Research Inc. All rights reserved.
Setsail Marketing
TermsPrivacyAffiliate Program
Risk Disclosure: The information and tools provided are for research and analytical purposes only and are not intended as investment advice. Market analysis involves uncertainty, and outcomes may differ from expectations. Users should conduct their own due diligence and consider their individual circumstances before making any financial decisions. Past performance is not necessarily indicative of future results.

Hypothetical Performance Disclosure: Hypothetical performance results have many inherent limitations, some of which are described below. No representation is being made that any account will or is likely to achieve profits or losses similar to those shown; in fact, there are frequently sharp differences between hypothetical performance results and the actual results subsequently achieved by any particular trading program. One of the limitations of hypothetical performance results is that they are generally prepared with the benefit of hindsight. In addition, hypothetical trading does not involve financial risk, and no hypothetical trading record can completely account for the impact of financial risk of actual trading. for example, the ability to withstand losses or to adhere to a particular trading program in spite of trading losses are material points which can also adversely affect actual trading results. There are numerous other factors related to the markets in general or to the implementation of any specific trading program which cannot be fully accounted for in the preparation of hypothetical performance results and all which can adversely affect trading results.

Testimonial Disclosure: Testimonials appearing on this website may not be representative of other clients or customers and is not a guarantee of future performance or success.