
Stocks are swinging by half as much as volatility ebbs

Key points:
- The S&P 500 spent a couple of days last week with tiny intraday ranges, half the usual range in recent months
- Tiny intraday moves have mostly preceded good returns for the index
- The 3-month average move has fallen by about half from 2022, which preceded excellent returns since 1982
Stocks have spent days barely moving
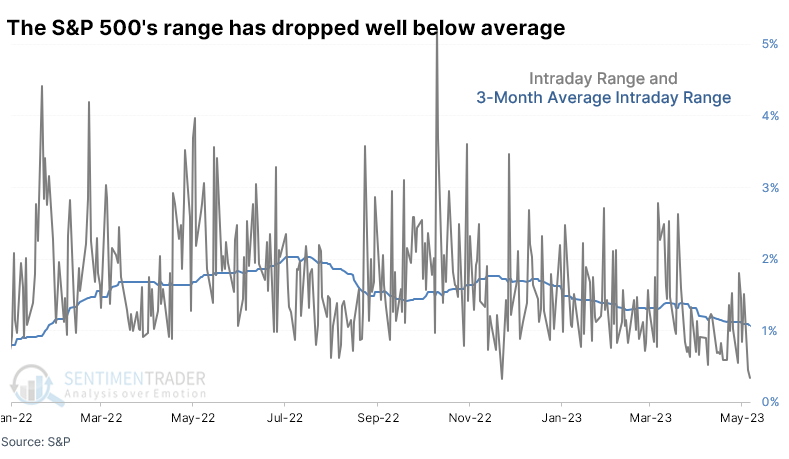
Ahead of the CPI print last week, the S&P 500 curled up during the day and didn't move much. Then it did it again. As a percentage of the closing price, the intraday range has been about as low as at any point over the past year and well below the average range of the past three months.
Small intraday ranges are considered bearish because they indicate that investors are complacent with the status quo and see no need to adjust their positions. Therefore, stocks will likely decline to jar investors out of that complacent mentality.
At least, that's the theory. It doesn't work in practice. We've looked at this phenomenon many times over the decades, and while it depends on context, low volatility tends to be more of a positive forward indicator for prices.
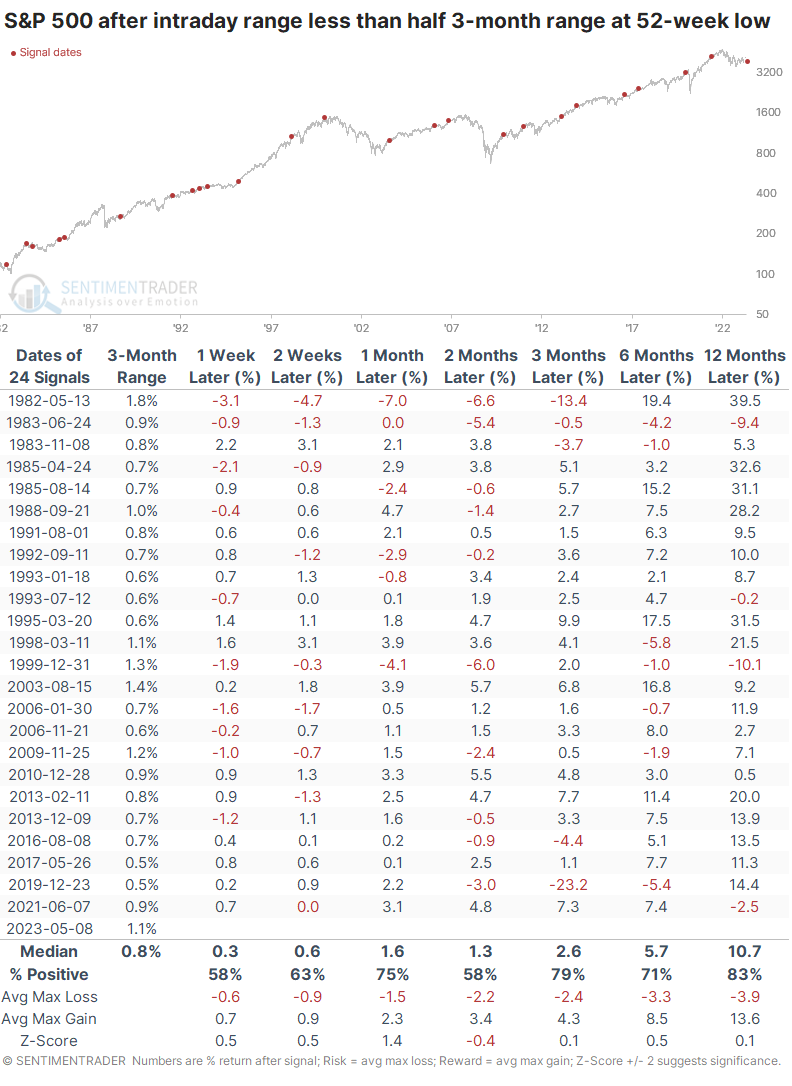
The table below shows all dates over the past 40 years (when intraday prices became more reliable) when the S&P's intraday range was less than half the average range over the past three months, and that three-month average had fallen to the lowest level in a year. These were super low-volatile days within an environment that was seeing volatility trend lower.
This triggered before some significant selloffs, most notably before the pandemic interruption. But most of the time, the S&P rose across time frames and showed above-average returns. There was only one double-digit loss over the following year, and that was just barely.
Cycling from a high- to low-volatility environment
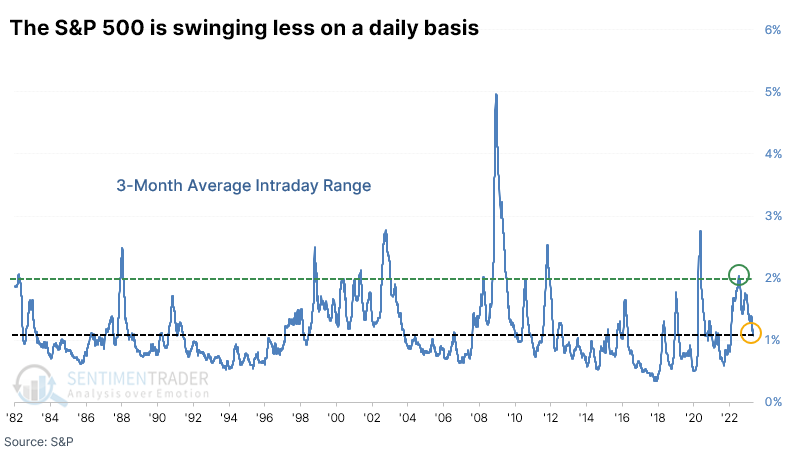
The S&P's average intraday range over the past three months has been declining steadily, from more than 2% last year to barely 1% now. It's still elevated compared to the past 40 years but has nearly halved from where it was almost a year ago.
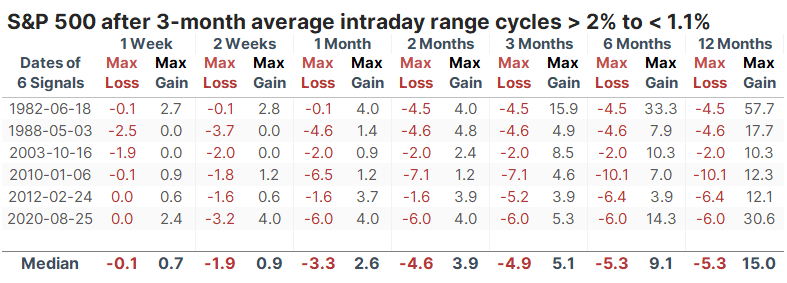
There aren't many precedents for intraday swings to cycle from an average of more than 2% to barely 1%. The table below outlines the handful of times it occurred, and it showed a consistent tendency to mark the ends of major corrective periods in the S&P 500. The index mainly showed strong returns from two to twelve months later, though there was some volatility after a couple of them.
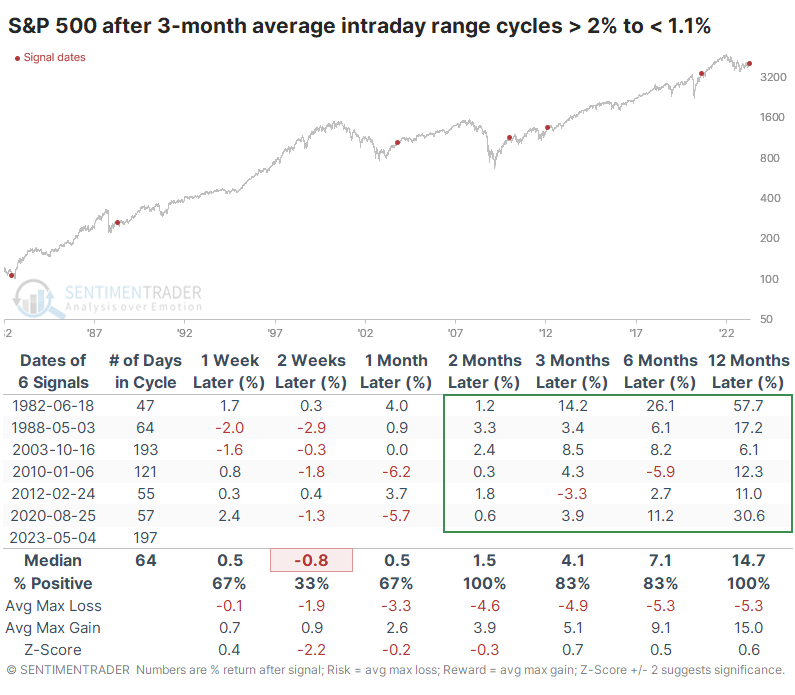
The table of maximum gains and losses across each time frame after those signals shows that the gains were mostly mediocre to strong, while the losses tended to be small. Only one signal saw a loss of more than -10% at any point within the next year, and that was just barely. All the other signals witnessed no more than a -6.4% drawdown at any point within the following year.
What the research tells us...
Investors suffered through one of the worst years on record for financial assets last year, so it's natural for them to grab onto any potential negative now. It's just human nature. Contrarians always tend to get disturbed when markets are calm, worried about the next jolt of volatility that's sure to come. Now that stocks are swinging less than they used to, it's logical to assume it's a bad sign. But there is no evidence that has been the case, and when volatility has cycled from extremely high, like in 2022, to about half as volatile as now, it has preceded excellent returns.