Products
SentimenTrader Trading Tools
‍
Backtest Engine
My Trading Toolkit
Correlation Analysis
Seasonality
Market Prediction
Indicators & Data API
‍
Proprietary Indicators & Charts
Market Data API
Strategies & Scanner
‍
50+ Trading Strategies
Smart Stock Scanner
Smart Option Scanner
Research Reports
‍
Research Solutions
Reports Library
Free Resources
Simple Backtest Calculator
Simple Seasonality Calculator
The Kelly Criterion Calculator
Sentiment Geo Map
Public Research Reports
Education
Sentiment Indicators
Technical Indicators
Pricing
Company
About
In the News
Testimonials
Client Success Stories
Contact
Log inLoginSign up
< BACK TO ALL REPORTS

Stocks and the dollar are "joined at the pip"

Jason Goepfert
2019-09-26
null

This is an abridged version of our recent reports and notes. For immediate access with no obligation, sign up for a 30-day free trial now.


Joined at the pip

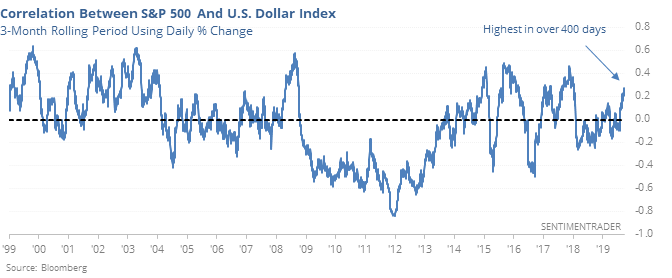
There usually isn’t much of a correlation between movement in stocks and the dollar. As much as investors want to assign a narrative linking the two during intraday gyrations, there is usually only a weak link. Over the past few months, though, they’ve moved together more consistently than any time in well over a year.
Stocks and the dollar are "joined at the pip"

This triggered before the crash in 1987, then again on the cusps of the two major bear markets in the 2000’s but it ignores the fact that it also preceded healthy rallies more often than it triggered before a crash.

For the buck, it led to weaker-than-average shorter-term returns, but decent longer-term ones.


A fast slow mover

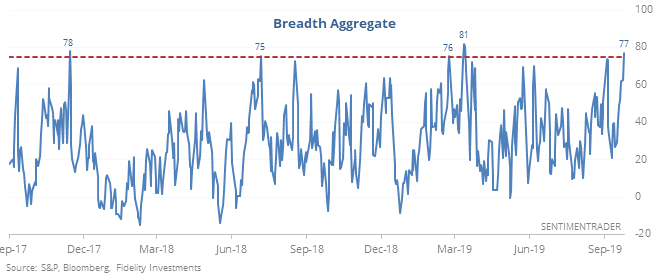
The utility sector is one of the slowest-moving of the majors, one reason it’s considered a defensive group. They’ve thrown off that shackle this week, with a jump in underlying buying pressure.
Stocks and the dollar are "joined at the pip"

When we see a sector like this undergo a move like that, it’s usually a negative for the sector and indeed, utility stocks rarely made further sustained headway. For the broader market, this typically happened during times of stress, and the S&P 500 most often rebounded over the medium-term.


Rollover

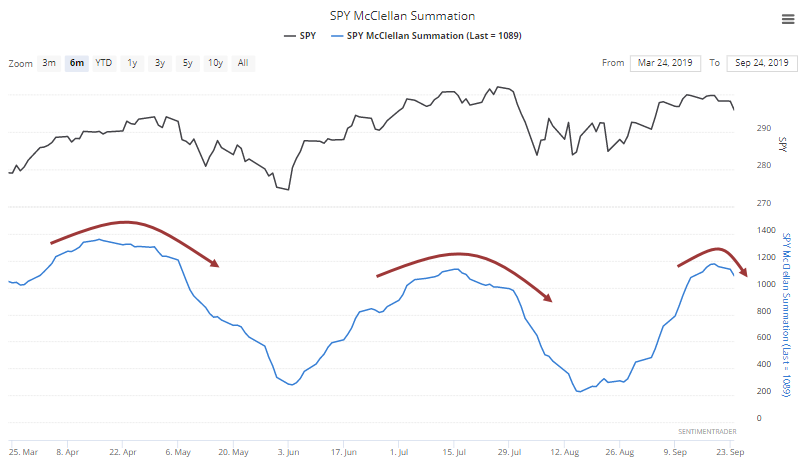
Long-term breadth momentum looks to be rolling over from a high level. The S&P 500 McClellan Summation Index is close to falling below 1050.
Stocks and the dollar are "joined at the pip"

But momentum rarely just disappears – the Backtest Engine shows us that the Summation has crossed below that level 28 times, and SPY was higher three months later after 27 of them (the sole loss was a miniscule -0.1%).


That was quick

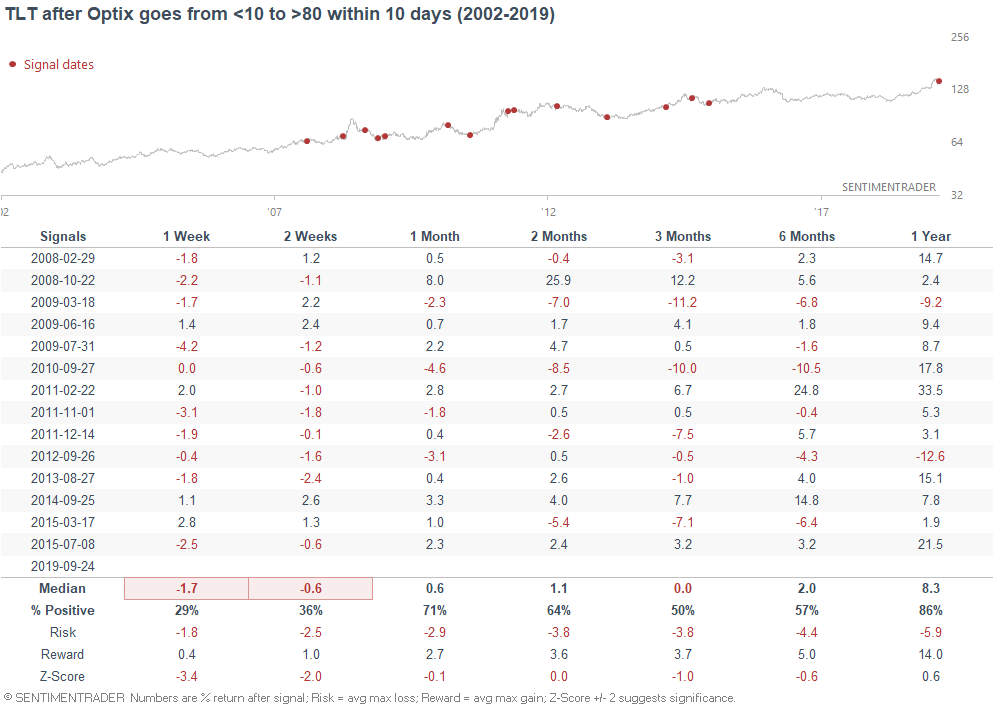
The Optimism Index on TLT went from deeply oversold to overbought very quickly. That has consistently led to poor short-term returns, and so far it looks like bonds are following through on that typical scenario.
Stocks and the dollar are "joined at the pip"

PRODUCTS
SentimenTrader
Trading Tools
Indicators & Data API
‍
Strategies & Scanner
‍
Research Reports
FREE
RESOUrCES
Simple Backtest
Calculator
Simple Seasonality
Calculator
The Kelly Criterion
Calculator
Sentiment Geo Map
‍
Public Research Reports
‍
Education
Sentiment Indicators
‍
Technical Indicators
‍
Pricing
Bundle pricing
‍
FAQ
‍
Announcements
‍
COMPANY
‍
About
‍
In the News
‍
Testimonials
‍
Client Success Stories
CONTACT
‍
General Inquiries
‍
Media Inquiries
‍
Financial Professionals Inquiries
‍
© 2026 Sundial Capital Research Inc. All rights reserved.
Setsail Marketing
TermsPrivacyAffiliate Program
Risk Disclosure: The information and tools provided are for research and analytical purposes only and are not intended as investment advice. Market analysis involves uncertainty, and outcomes may differ from expectations. Users should conduct their own due diligence and consider their individual circumstances before making any financial decisions. Past performance is not necessarily indicative of future results.

Hypothetical Performance Disclosure: Hypothetical performance results have many inherent limitations, some of which are described below. No representation is being made that any account will or is likely to achieve profits or losses similar to those shown; in fact, there are frequently sharp differences between hypothetical performance results and the actual results subsequently achieved by any particular trading program. One of the limitations of hypothetical performance results is that they are generally prepared with the benefit of hindsight. In addition, hypothetical trading does not involve financial risk, and no hypothetical trading record can completely account for the impact of financial risk of actual trading. for example, the ability to withstand losses or to adhere to a particular trading program in spite of trading losses are material points which can also adversely affect actual trading results. There are numerous other factors related to the markets in general or to the implementation of any specific trading program which cannot be fully accounted for in the preparation of hypothetical performance results and all which can adversely affect trading results.

Testimonial Disclosure: Testimonials appearing on this website may not be representative of other clients or customers and is not a guarantee of future performance or success.