
Stocks and interest rates (and what you really need to know)

Key Points
- The trend in interest rates is an important factor relating to stock market performance
- A declining trend in interest rates is significantly more favorable for stocks than a rising trend…
- …although rising interest rates are not the automatic bull-market killing bogeyman that many pundits make them out to be
- For our testing purposes, we will use one objective monthly calculation to deem the trend in interest rates as "rising" or "falling"
Defining the trend in interest rates
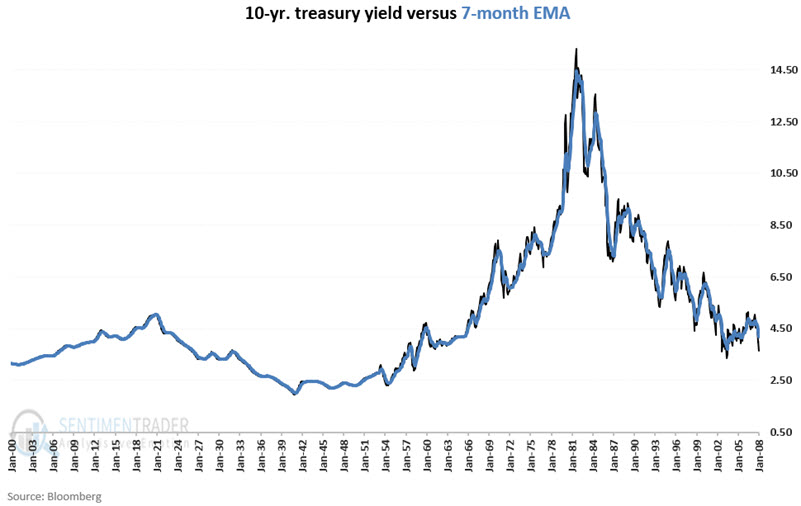
There are many ways to designate the trend in interest rates as rising or falling. For our purposes, we will compare the 10-year treasury yield (ticker TNX or $TNX) to its own 7-month exponential moving average. If the month-end reading for TNX is:
- below its 7-month EMA, we will deem interest rates to be "falling"
- above its 7-month EMA, we will deem interest rates to be "rising"
Our starting hypothesis is that falling rates are favorable for stocks and that rising rates are unfavorable for stocks.
The chart below displays TNX and its 7-month EMA going back to 1900.
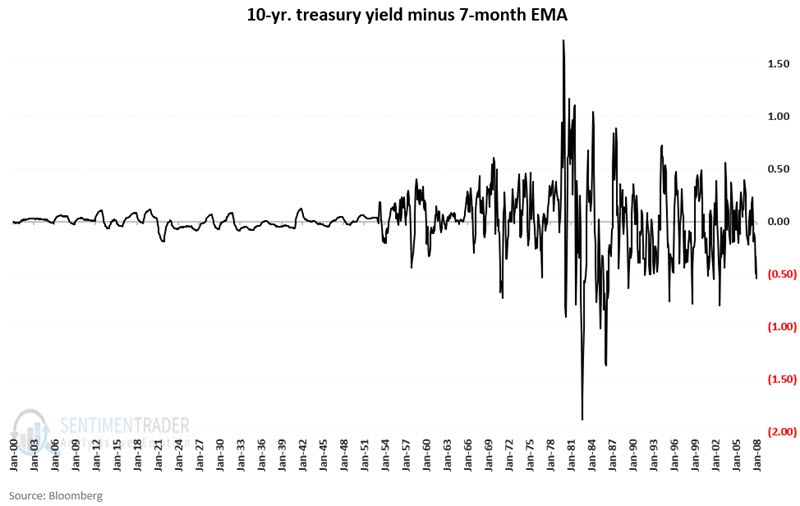
The chart below displays the difference between TNX and its 7-month EMA. A negative number means rates are "falling." A positive number means rates are "rising."
Now let's take a look at market results.
What we are testing
For testing purposes, we will consider the results using month-end data from June 1926 through February 2022 for:
- 11 sector indexes
- The S&P 500 Index
The sector data use the Fama French sector database from 1926 to 1990 and the S&P 500 Sector indexes after 1990.
Average monthly return
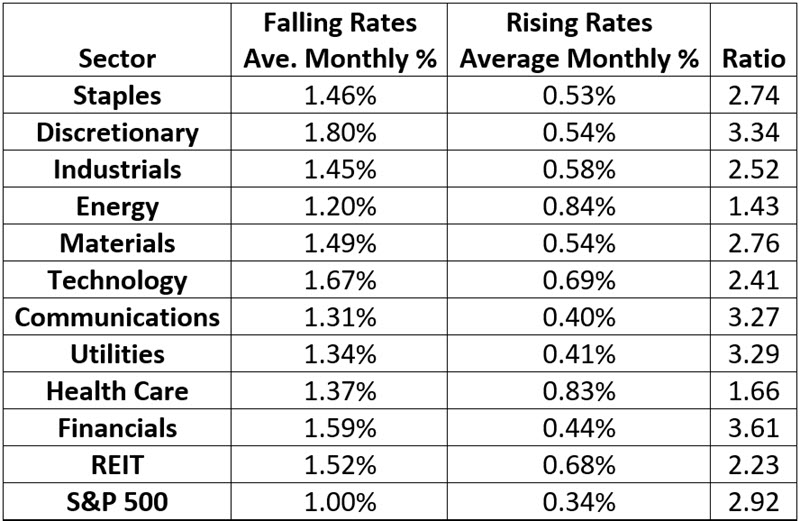
The table below displays the average monthly % +(-) for each sector plus the S&P 500 Index depending on whether the previous month showed rising rates (TNX > 7-mo. EMA) or falling rates (TNX < 7-mo EMA).
The far right-hand column displays the ratio between the average monthly return when rates are falling and the average monthly return when rates rise.
Cumulative return
The table below displays the cumulative % +(-) for each sector plus the S&P 500 Index depending on whether the previous month showed rising rates (TNX > 7-mo. EMA) or falling rates (TNX < 7-mo EMA).
The far right-hand column displays the ratio between the cumulative return when rates are falling divided by the cumulative return when rates are rising.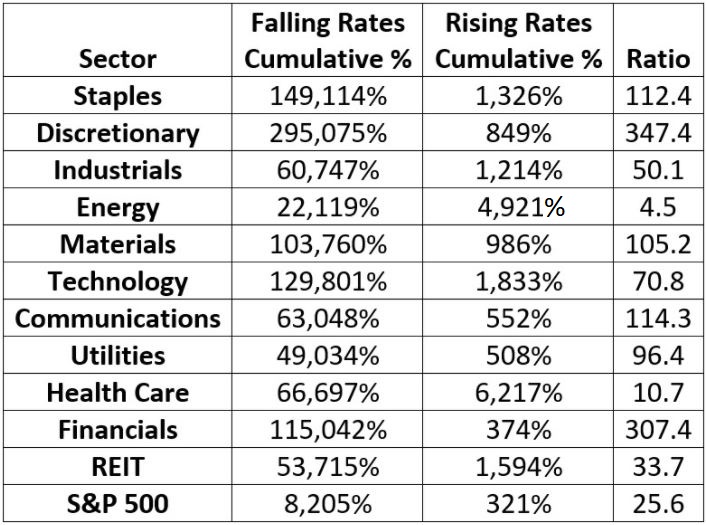
Key things to note
There are several key takeaways from the numbers above, including:
- Stock performance is much better when rates are falling
- Stock performance IS NOT negative when rates are rising, only much more muted
- Individual sectors tend to outperform S&P 500 Index over time
- Sector selection is critical
For each sector, the monthly and cumulative performance was significantly better when rates were falling than when rates were rising. At the same time, it is essential to note that sector returns are solidly positive overall during rising rate periods. This suggests treating rising rates as more of a warning to modify one's expectations regarding return than as some out-and-out sell signal.
Buying and holding index funds has become a modus operandi for many investors in recent years, primarily due to convenience and familiarity. However, the results above clearly demonstrate the potential benefit of focusing on individual sectors rather than buying and holding an S&P 500 Index fund.
Lastly, let's highlight a sector-based approach to using this information.
A sector-based approach regarding interest rates
As the results below are generated with the benefit of 100% hindsight, we are not advocating it as a standalone strategy per se. The purpose is primarily to illustrate the importance of interest rates trends related to stocks and the importance of sector selection.
Over the 95+ years encompassed in the test above, consumer discretionary was the top-performing sector during periods of falling interest rates, and health care was the top-performing sector during periods of rising interest rates.
It should be spelled out clearly that there is no guarantee that this will always be the case or continue ad infinitum into the future. But for the sake of illustration, let's consider the results of the following strategy:
- If 10-year Treasury yield closed last month BELOW its 7-month EMA, then this month hold the consumer discretionary sector (this presently can be accomplished by holding ticker XLY (Consumer Discretionary Select Sector SPDR ETF)
- If 10-year Treasury yield closed last month ABOVE its 7-month EMA, then this month hold the health care sector (this presently can be accomplished by holding ticker XLV (Health Care Select Sector SPDR ETF)
The chart below displays the growth of $1 using this strategy versus the growth of $1 invested in the S&P 500 Index on a buy-and-hold basis using a logarithmic scale.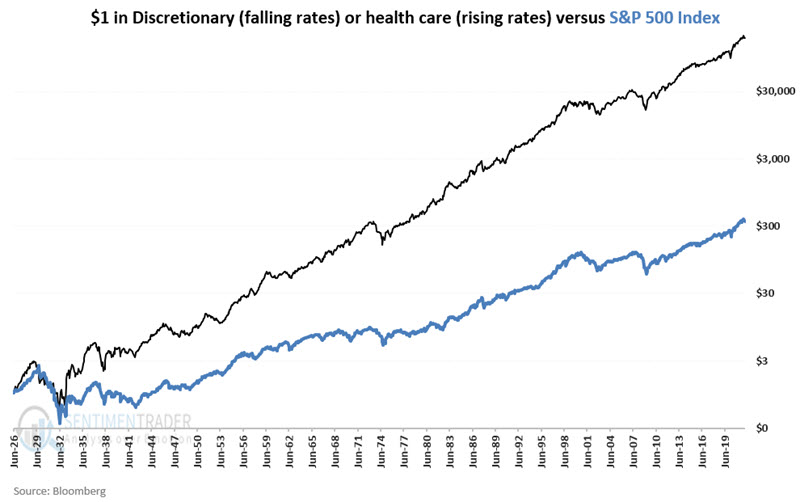
Finally, the chart below divides the black line in the chart above by the blue line.
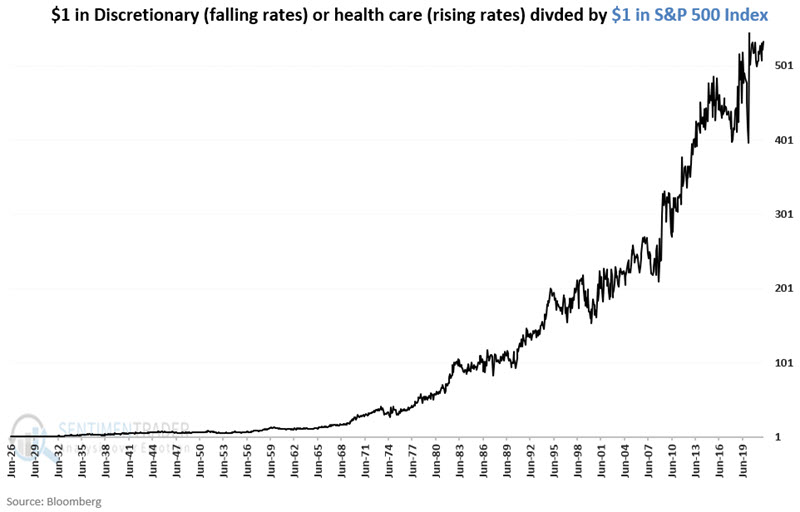
The takeaway from the chart above is that the switching strategy outperformed buying-and-holding the S&P 500 Index; however, it was by no means a straight-line advance, and the strategy can underperform buy-and-hold for years at a time. Alas, such is the reality of most trading strategies.
What the research tells us…
The evidence above suggests that when interest rates are in an objectively established downtrend, investors should seek to maximize gains in the stock market. When interest rates are in an objectively established uptrend, investors must adjust their expectations regarding the stock market and remember that a rising trend in rates is not necessarily a "sell everything" warning.
In addition, the results above remind us of the potential benefit of focusing on top-performing sectors versus simply buying and holding an index fund.