
Stock indexes are extended below their lower Bollinger Bands

Key points:
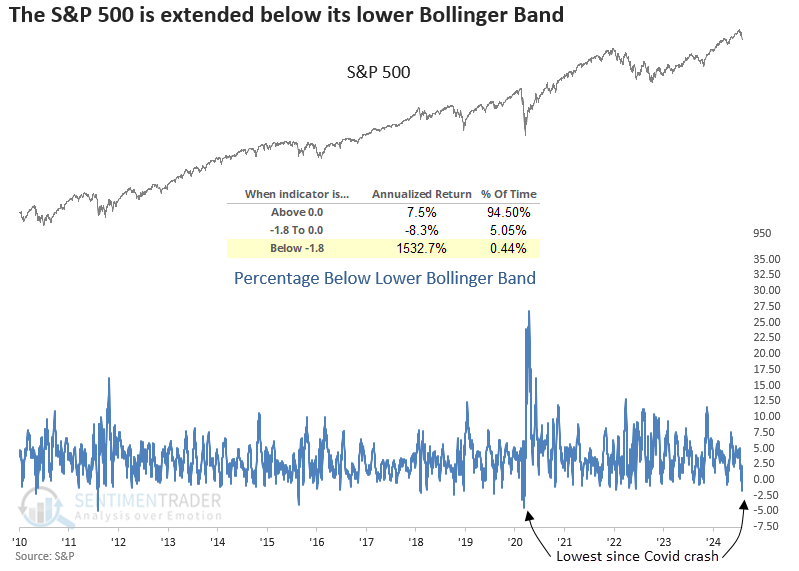
- The S&P 500 recorded its deepest close below the lower Bollinger Band since the Covid crash
- Similar price patterns in an uptrend led to an S&P 500 rally 85% of the time over the next six months
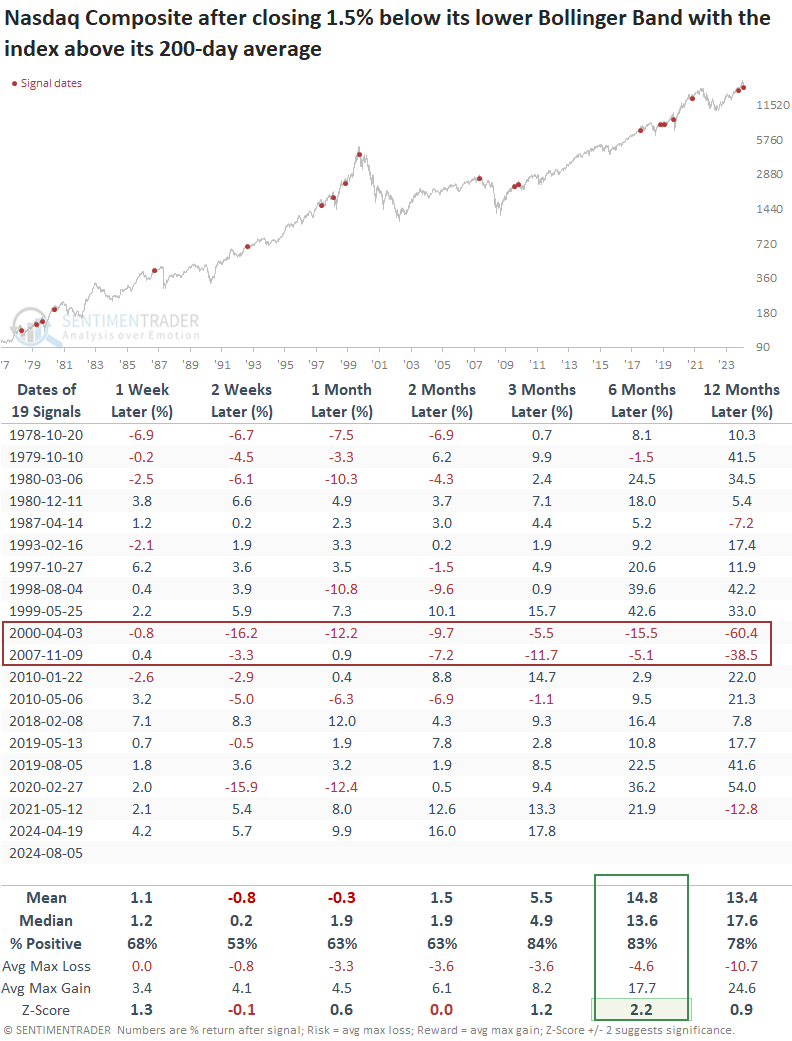
- A comparable scenario for the Nasdaq Composite suggests it will rally over the following six months
A technique for detecting an oversold condition
In the absence of a wholesale oversold condition from market breadth indicators despite an 8.49% correction in the world's most benchmarked index, I decided to examine the price action in the S&P 500 using Bollinger Bands, a popular technical indicator developed by John Bollinger. Bollinger Bands expand or contract based on volatility, making them a timely indicator to examine, given the extreme volatility over the last few sessions.
For only the 57th time since 1928, the S&P 500 closed more than 1.8% below its lower Bollinger Band, indicating an extreme downside extension in price relative to a volatility-derived benchmark. As the chart below shows, values below this level have occurred less than 1% of the time since 1928, resulting in massive annualized returns.
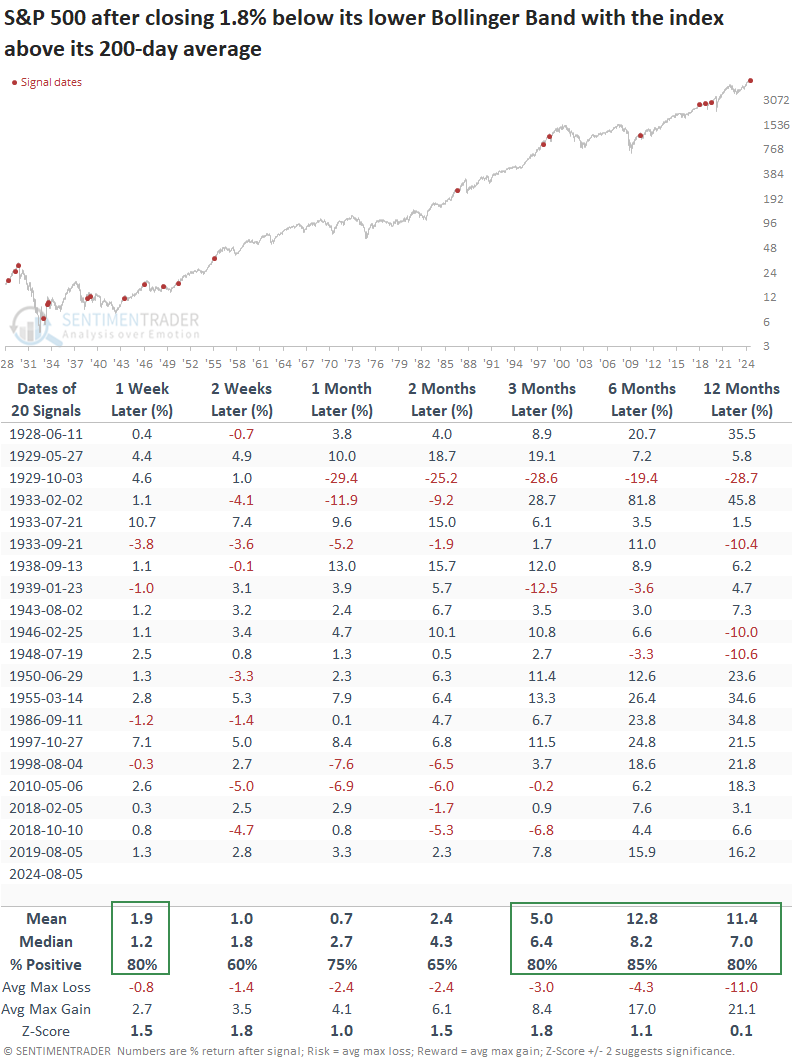
Recognizing that context is always essential, this downside extension in price relative to the lower Bollinger Band occurred with the S&P 500 trading above its 200-day average, a scenario seen only 20 other times since 1928. The previous signal occurred in August 2019, leading to a 7.8% rally over the subsequent three months.
I screened out repeats by identifying the first signal in 30 sessions, which is the optimal days-in-trade holding period based on a historical test.
Comparable downside price action preceded positive returns
Whenever the S&P 500 closed more than 1.8% below its lower Bollinger Band while remaining above its 200-day average, it demonstrated a strong tendency to rebound swiftly, rising 80% of the time a week later. Over the next three to twelve months, the S&P 500 continued to rally 80% to 85% of the time, suggesting that significant dips below the lower Bollinger Band often led to a resumption of the uptrend.
The only notable exception to this pattern was in October 1929, when the signal coincided with a major market top.
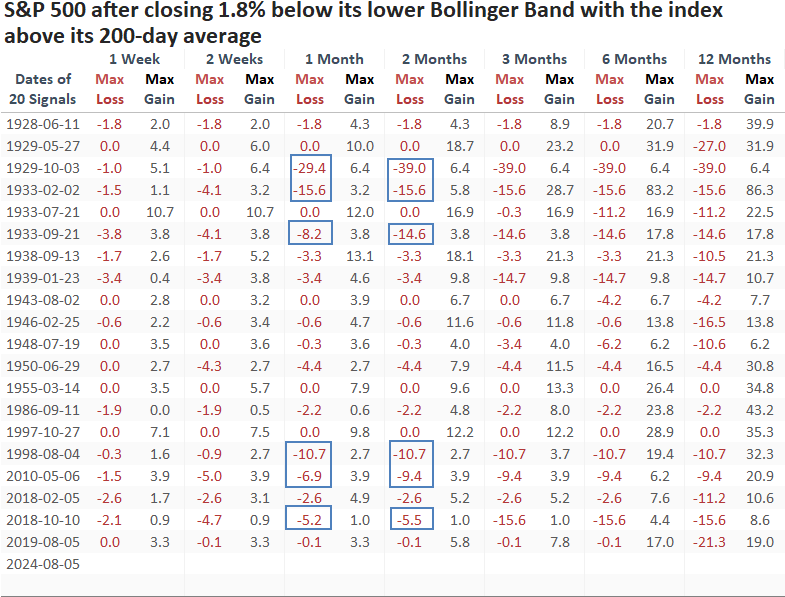
Over the next two months, a maximum loss exceeding -5% was limited to six precedents, with most linked to some sort of event like the flash crash or LTCM. So, because the unwind of the yen-carry trade contributed to the current drawdown, investors need to be open to all outcomes and manage risk appropriately.
What about the more volatile Nasdaq Composite?
While not as extreme as the S&P 500, the Nasdaq Composite closed 1.54% below its lower Bollinger Band, an event occurring less than 1% of the time since 1971. Readings below 1.50% produced significant annualized returns.
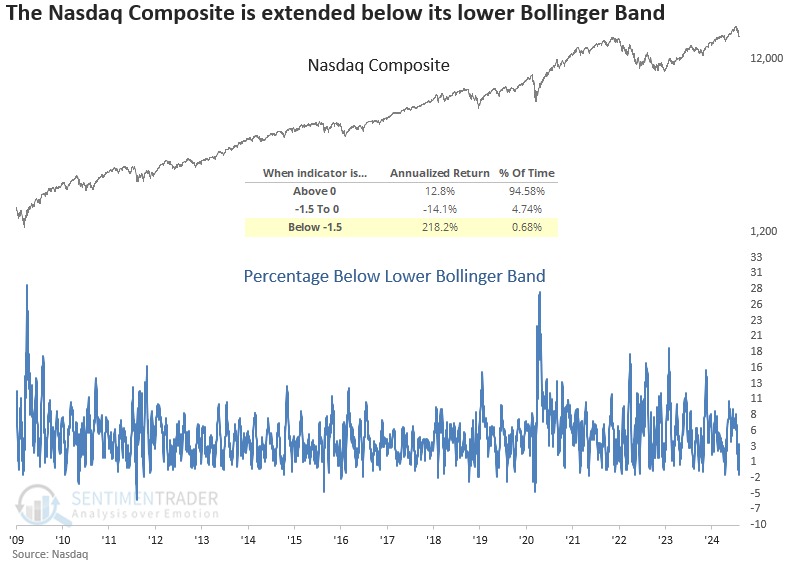
The Nasdaq Composite tended to bounce back the following week, although its win rate was not as robust as that of the S&P 500. Over the following six months, the index rallied 83% of the time, with its median return showing significance relative to random returns over the study period.
Only two precedents coincided with significant market peaks, both linked to market bubbles.
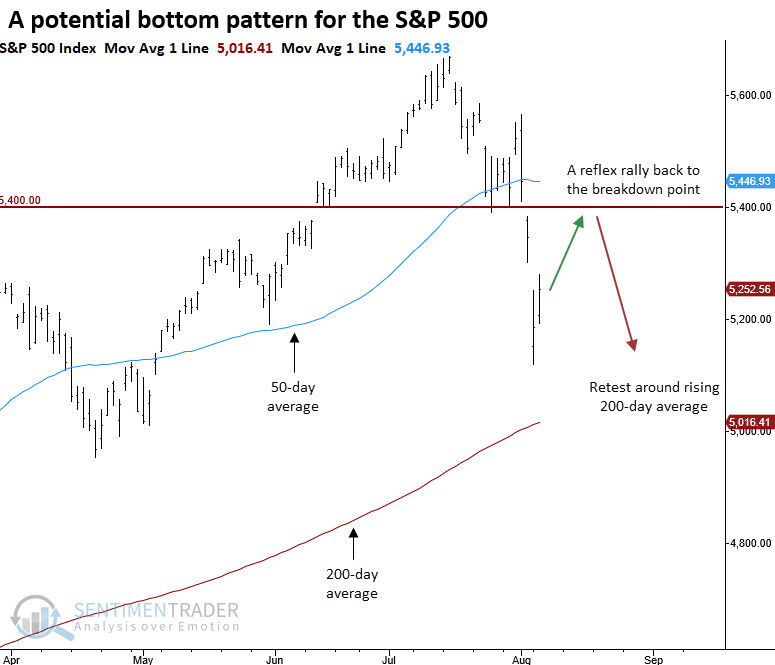
A purely subjective point of view
Should a reflex rally occur in response to the Bollinger Band signal, a best-case scenario could see the S&P 500 rebound to the breakdown point around 5400. However, given the typical behavior of corrections, investors should expect some backing and filling, with the S&P 500 possibly revisiting the lows or encountering a rising 200-day average.
What the research tells us...
The S&P 500 and the Nasdaq Composite have plummeted recently, driving the indexes significantly beneath their lower Bollinger Bands, indicating an oversold condition within a long-term uptrend. Similar scenarios suggest they could bounce back quickly, especially the S&P 500. More importantly, medium- and long-term returns and consistency suggest both indexes reestablish their uptrends. However, we must be mindful that corrections usually undergo a bottoming process, so a retest around the lows or a rising 200-day average is possible.