
Still watching natural gas closely

Key Points
- In an early December piece, I wrote of an unfavorable seasonal period for Natural gas
- Natural gas plunged for one week and has since rallied steadily
- History suggests that traders prepare for the other shoe to drop
The unfavorable window started bearish…then reversed sharply
As detailed here, natural gas entered an unfavorable period in early December that extends from Trading Day of Year #236 through TDY #31 of the following year. For 2023-24, this period extends from the close on 2023-12-04 through the close on 2004-02-15.
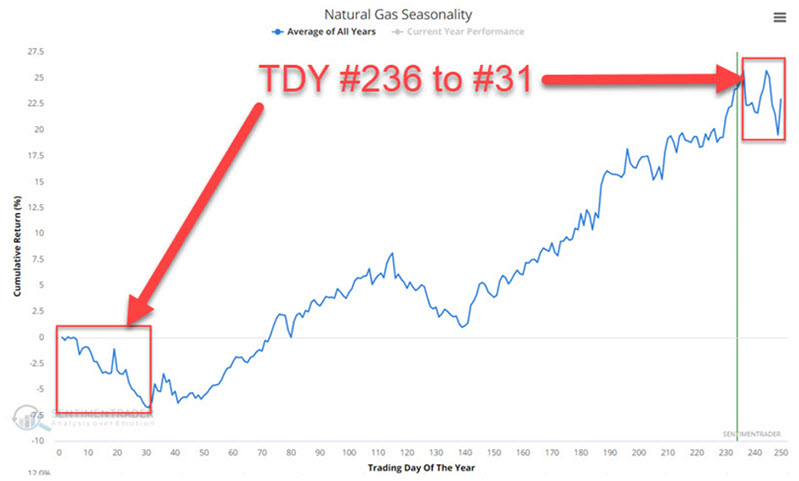
During the first six trading days of this period, natural gas plunged over $3,800 in contract value, and it looked like the rout was on. But things changed abruptly, and natural gas has since rallied over $5,700 in contract value through the close on 2023-01-05.
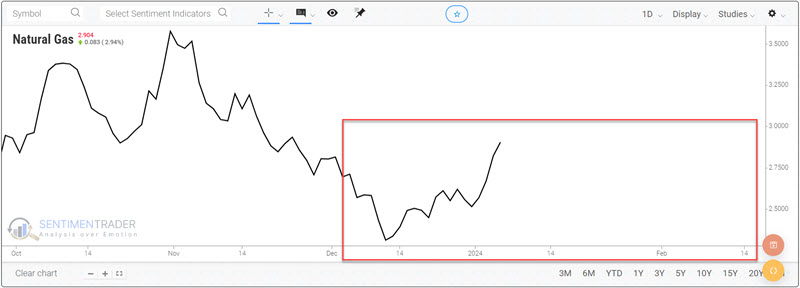
Can and will this latest rally continue? History suggests that natural gas traders remain alert for an opportunity to play the short side.
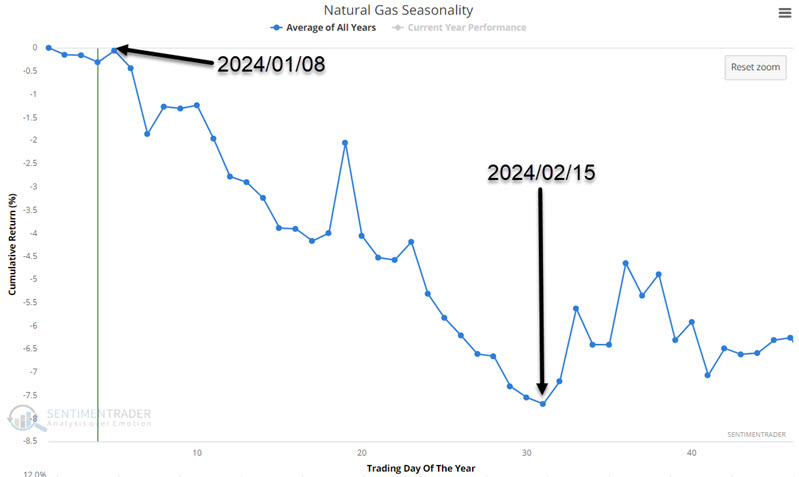
TDY #5 through TDY #31
The chart below zooms in on the annual seasonal trend for natural gas. Historically, the period from Trading Day of the Year (TDY) #5 through TDY #31 has witnessed weakness.
The chart below displays the hypothetical cumulative $ +(-) achieved by holding a long position in natural gas futures only from the close of TDY #5 through TDY #31 every year since 1991.
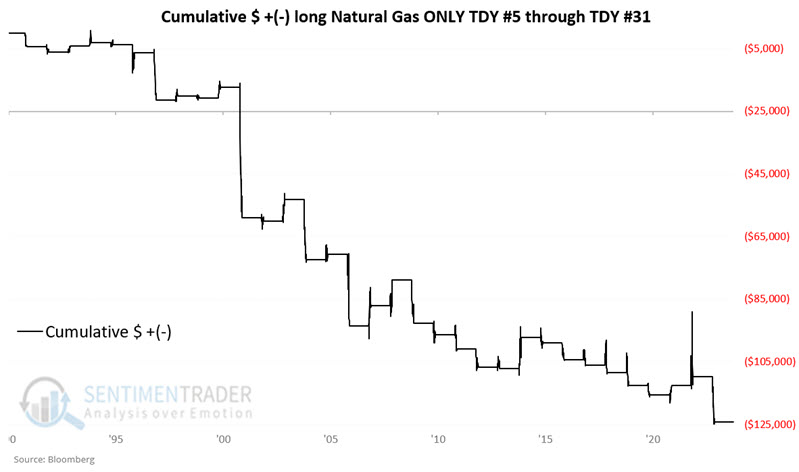
The table below summarizes natural gas performance during this relatively short window.
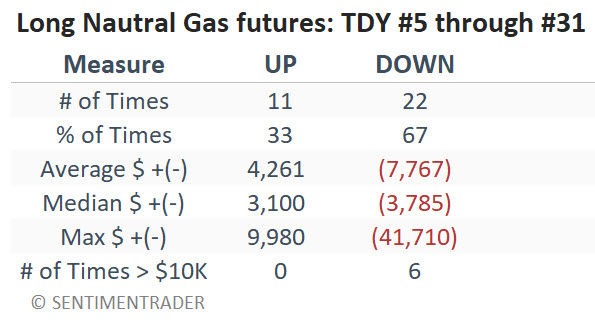
While the chart above gives the appearance of a relentless decline, the reality shown in the table above is that in 1 out of 3 years, natural gas shows a gain during this period. So, as always, there are no sure things.
What the research tells us...
The history suggests that speculative traders looking to put the odds in their favor look for opportunities to play the short side of natural gas between now and mid-February 2024. Note that trading natural gas futures entails significant leverage and risk. Non-futures traders might consider a bearish option position using options on the United States Natural Gas Fund ETF (ticker UNG).