Products
SentimenTrader Trading Tools
‍
Backtest Engine
My Trading Toolkit
Correlation Analysis
Seasonality
Market Prediction
Indicators & Data API
‍
Proprietary Indicators & Charts
Market Data API
Strategies & Scanner
‍
50+ Trading Strategies
Smart Stock Scanner
Smart Option Scanner
Research Reports
‍
Research Solutions
Reports Library
Free Resources
Simple Backtest Calculator
Simple Seasonality Calculator
The Kelly Criterion Calculator
Sentiment Geo Map
Public Research Reports
Education
Sentiment Indicators
Technical Indicators
Pricing
Company
About
In the News
Testimonials
Client Success Stories
Contact
Log inLoginSign up
< BACK TO ALL REPORTS

Still waiting on health care

Jay Kaeppel
2022-05-19
In the face of difficult price action, various indicators are flashing favorable signs for the health care sector. Insider buying, breadth, and sentiment suggest that better days may not be far off for this vital sector.

Key Points

  • The health care sector is presently signaling favorable developments in a wide variety of factors
  • The ratio of insider buying versus selling has been decidedly bullish of late
  • Both breadth and sentiment have fallen to a deeply oversold level - i.e., bullish on a contrarian basis
  • Correlations among health care stocks have increased dramatically, which typically suggests market investors are indiscriminately "dumping" stocks in a given sector
  • Health care has a history of performing better than almost all other sectors when inflation is high and interest rates are rising - a situation we find ourselves in today

Insider buying

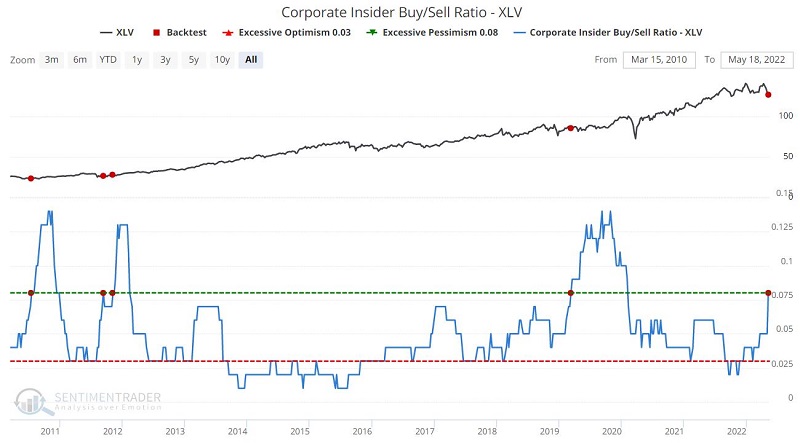
The action in corporate insider buying and selling for the companies that comprise ticker XLV (Health Care Select Sector SPDR Fund) continues to unfold in a manner that has historically been favorable for the health care sector.

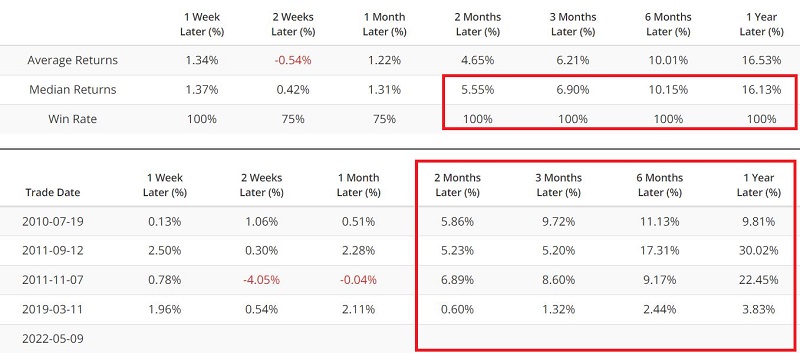
The chart below displays ticker XLV and when our Corporate Insider Buy/Sell Ratio - XLV crossed above 0.079. The table shows a summary of XLV performance following previous signals.

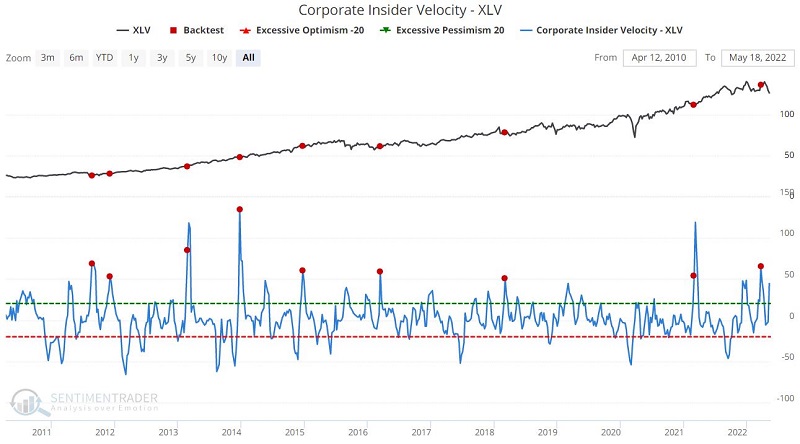
Another take on insider buying involves our Corporate Insider Buy/Sell Velocity - XLV indicator, which compares the 4-week change in insider buying to the 4-week change in insider selling to highlight extremes.

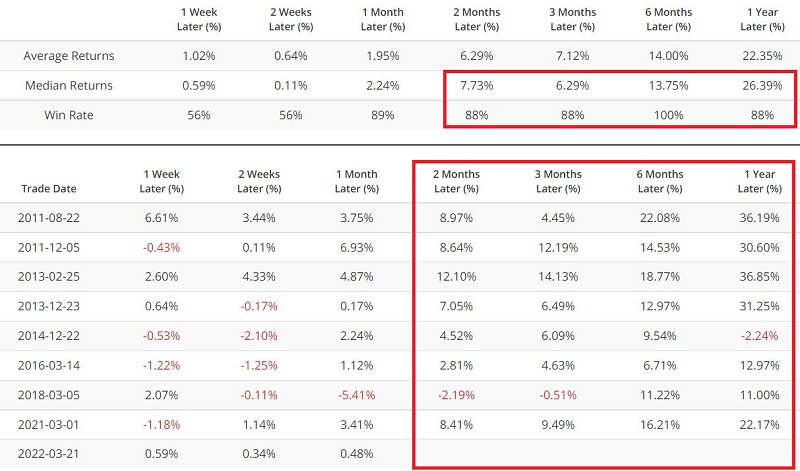
The chart below displays those times when this indicator crossed above 50, and the table summarizes XLV performance following previous signals.

Breath

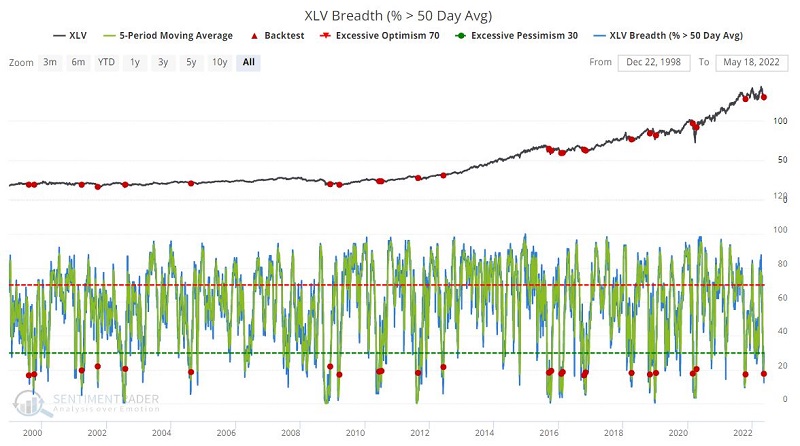
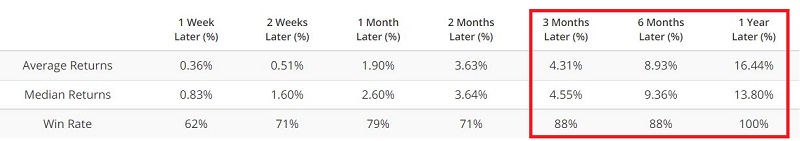
The chart below displays those times when the 5-day average of % XLV stocks > 50-day average crossed above 16, and the table shows a summary of XLV performance following previous signals.

Sentiment

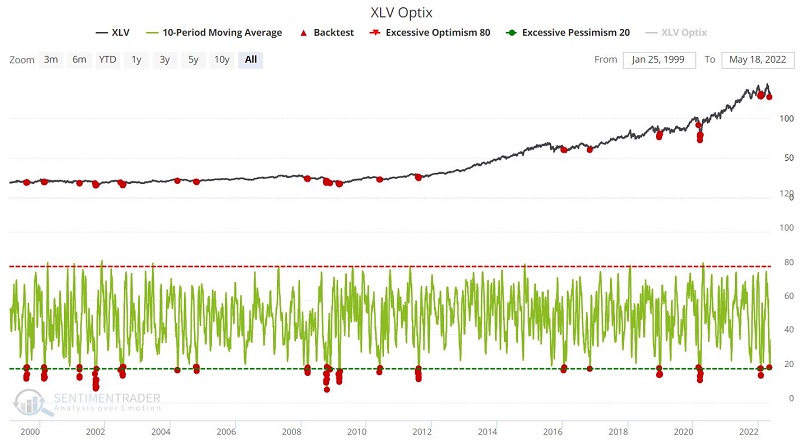
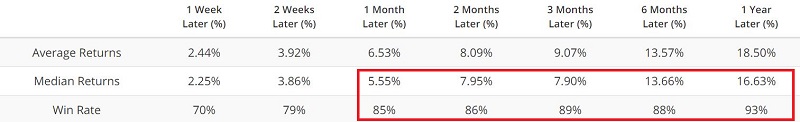
The chart below displays all days when the 10-day average of XLV Optix was below 21, and the table displays a summary of XLV performance following previous signals.
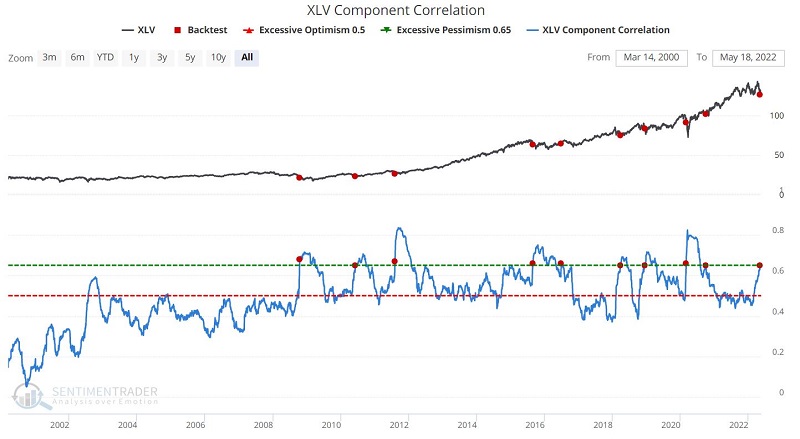
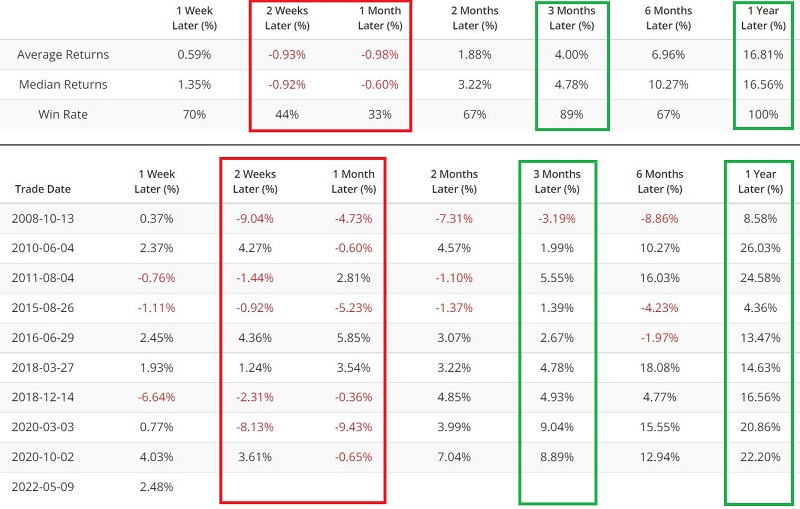
Correlation

The chart below displays all days when the XLV Component Correlation indicator crossed above 0.65 for the first time in six months. The table shows a summary of XLV performance following previous signals.

High Inflation and Rising Interest Rates

I tested S&P 500 Sector performance back to 1926 when BOTH:

  • CPI 12-month % rate-of-change > 4%
  • 10-year treasury yield > its 7-mo. EMA

The Health Care sector was the second-best performing sector when inflation was high and interest rates were rising (Energy showed the largest net gain, but with a much greater degree of volatility and much larger maximum drawdown).

The chart below displays the growth of $1 invested in the S&P 500 Health Care sector ONLY when inflation was above 4%, AND the 10-year yield was above its 7-month EMA.

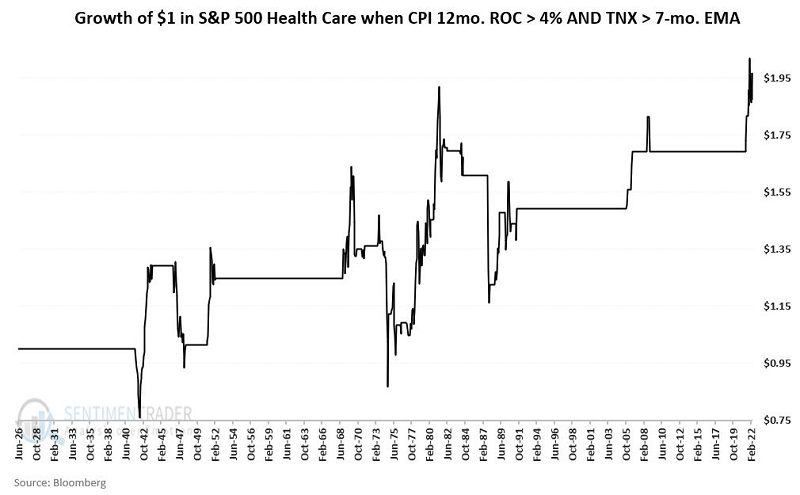
Not necessarily a "pretty picture," but on a relative basis, this was about as good as it got for any stock sector when inflation was high and interest rates are rising.

What the research tells us…

The good news is that the health care sector is presently flashing about as many favorable signals as a sector ever does at one time. In addition, it has a track record of holding up (reasonably well) when inflation is high, and interest rates are rising. The bad news is that there are never any guarantees in the stock market, particularly in the teeth of a major decline.

PRODUCTS
SentimenTrader
Trading Tools
Indicators & Data API
‍
Strategies & Scanner
‍
Research Reports
FREE
RESOUrCES
Simple Backtest
Calculator
Simple Seasonality
Calculator
The Kelly Criterion
Calculator
Sentiment Geo Map
‍
Public Research Reports
‍
Education
Sentiment Indicators
‍
Technical Indicators
‍
Pricing
Bundle pricing
‍
FAQ
‍
Announcements
‍
COMPANY
‍
About
‍
In the News
‍
Testimonials
‍
Client Success Stories
CONTACT
‍
General Inquiries
‍
Media Inquiries
‍
Financial Professionals Inquiries
‍
© 2026 Sundial Capital Research Inc. All rights reserved.
Setsail Marketing
TermsPrivacyAffiliate Program
Risk Disclosure: The information and tools provided are for research and analytical purposes only and are not intended as investment advice. Market analysis involves uncertainty, and outcomes may differ from expectations. Users should conduct their own due diligence and consider their individual circumstances before making any financial decisions. Past performance is not necessarily indicative of future results.

Hypothetical Performance Disclosure: Hypothetical performance results have many inherent limitations, some of which are described below. No representation is being made that any account will or is likely to achieve profits or losses similar to those shown; in fact, there are frequently sharp differences between hypothetical performance results and the actual results subsequently achieved by any particular trading program. One of the limitations of hypothetical performance results is that they are generally prepared with the benefit of hindsight. In addition, hypothetical trading does not involve financial risk, and no hypothetical trading record can completely account for the impact of financial risk of actual trading. for example, the ability to withstand losses or to adhere to a particular trading program in spite of trading losses are material points which can also adversely affect actual trading results. There are numerous other factors related to the markets in general or to the implementation of any specific trading program which cannot be fully accounted for in the preparation of hypothetical performance results and all which can adversely affect trading results.

Testimonial Disclosure: Testimonials appearing on this website may not be representative of other clients or customers and is not a guarantee of future performance or success.