
Still waiting on gold...

Key Points
- For years gold has been touted by some as the "ultimate inflation hedge"
- Yet despite the massive spike in inflation in the last year, gold has not made great headway
- Despite showing some "signs of life" recently, investors may be wise to let gold "prove itself" before piling into the yellow metal
Gold as it is
I highlighted some good and bad news for gold in a recent two-part series (here and here). Let's take a closer look at its current status.
The two charts below show the major crux of the various bullish and not so bullish arguments regarding gold. The chart below (courtesy of StockCharts) displays a bar chart of gold that purports to show a "bullish upside breakout" from a consolidation pattern.
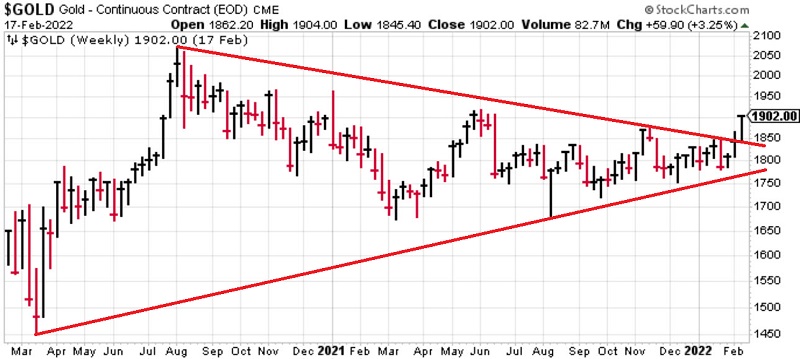
Looks impressive. However, the chart below shows the same price action for gold but suggests that gold is instead facing multiple resistance levels that may constrain any near-term gains rather than breaking out to the upside.
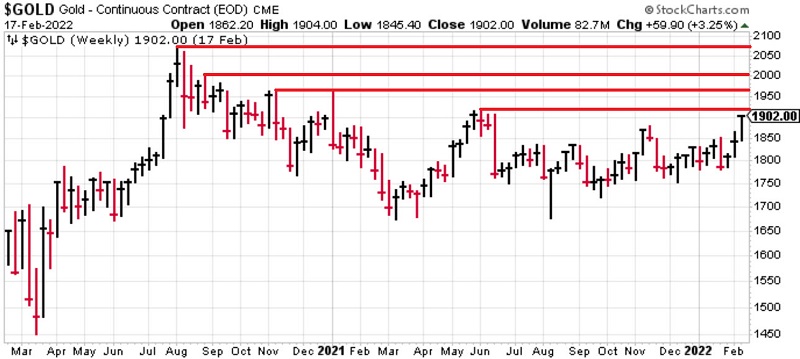
Which interpretation will be correct? While everyone can make their own assertions and arguments, the reality is that only time will tell.
In the recent "bad news" article, I touched on the Gold/SPX ratio versus its 200-week EMA. As you can see in the chart below, despite the recent strength in gold and weakness in stocks, this ratio remains below the moving average - i.e., objectively still in a downtrend.
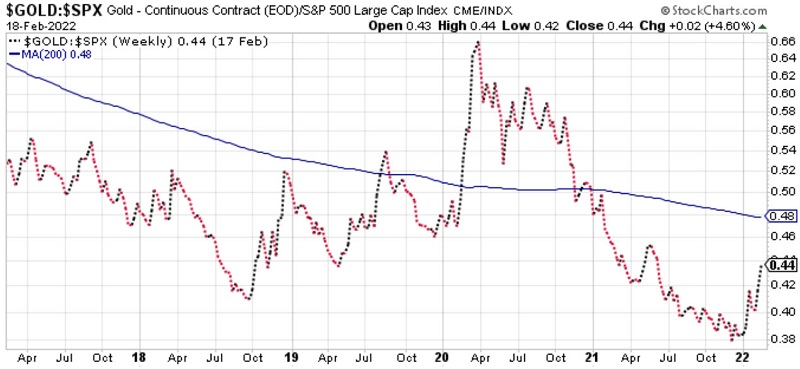
A move by this ratio above the 200-week EMA would greatly improve the bullish argument.
Gold Seasonality
The chart below displays the annual seasonal trend for gold futures. Note that a period of seasonal strength is about to end, a period of seasonal weakness is about to begin, and a period of seasonal "blah" (for lack of a better term) extends for the next several months.
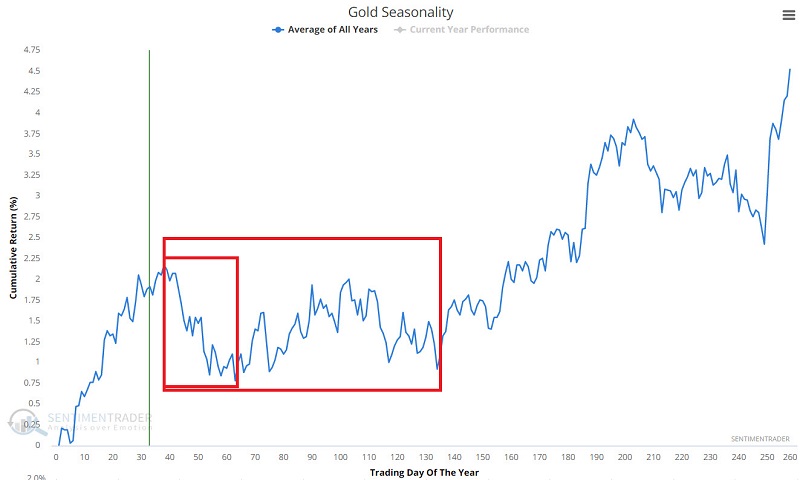
None of this precludes gold from moving higher in the months directly ahead, as seasonal trends do not always play out as they have in the past. But this does provide another reason to make gold "prove itself" before buying into the bullish argument.
Feb TDM #18 + 25 Days
One seasonal period to pay attention to begins the close of the 18th trading day of February and extends through the subsequent 25 trading days. For 2022, this period extends from the close on 2/25/2022 through the close on 3/31/2022.
The chart below displays the cumulative hypothetical $ +(-) achieved by holding a long position in gold futures only during this period each year since 1975.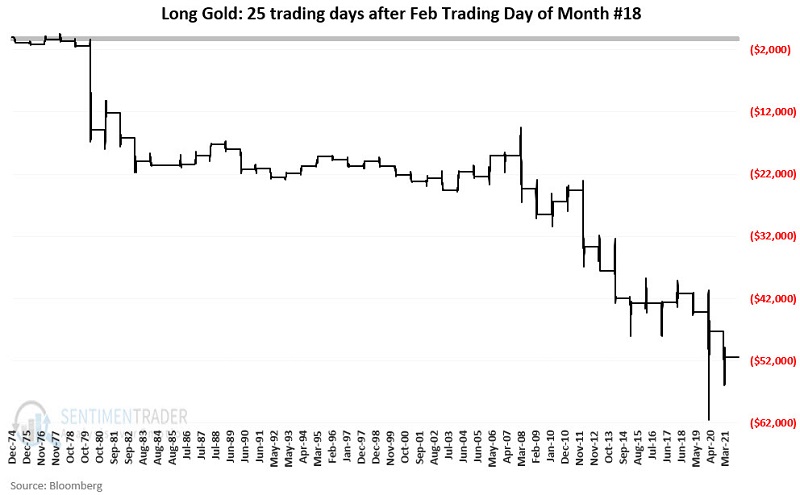
The table below displays a summary of the results.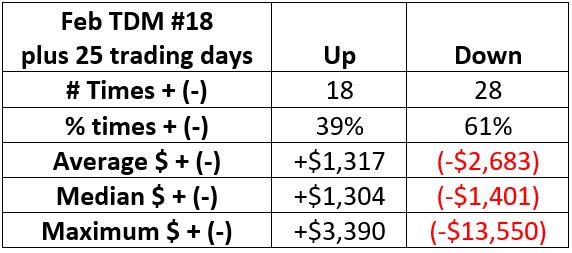
If we look at an ETF alternative, the chart below displays the cumulative growth of $1 invested in ticker GLD (SPDR Gold Shares) only during this seasonally unfavorable period since the fund started trading in 2004.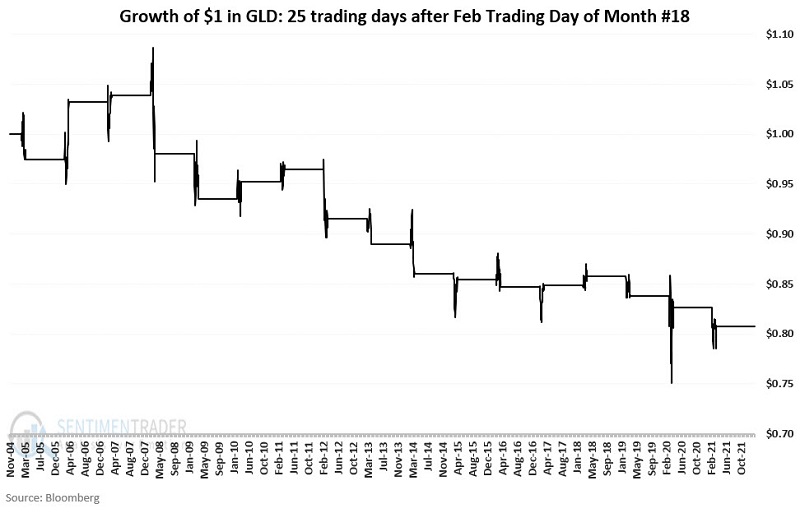
Note that GLD has lost ground during this period in 11 out of 17 years, or 65% of the time.
What the research tells us…
There is no reason that gold cannot advance significantly in price from its current level. Given the current level of inflation and gold's reputation as a supposed inflation hedge, such a move would almost seem overdue. But as I have pointed out, there is plenty of room for reasonable doubt regarding the prospect for a gold rally in the near term. Once again, investors may wish to make gold prove its bullish mettle before jumping on the bandwagon.