
Staying the course in biotech... for now

Key points
- I wrote about the iShares Biotechnology ETF (ticker IBB) entering a favorable seasonal period in early May. Results so far have been decent
- The good news is that the price trend is presently favorable, and July has historically been a good month for the biotech sector
- The bad news is that IBB ran into resistance; It must rise above this level to sustain a rally
Biotech (finally) bounces
The chart below shows that after entering a favorable seasonal period at the close of 2024-05-06, IBB traded sideways for over a month. Finally, in the past week, IBB popped to the upside.
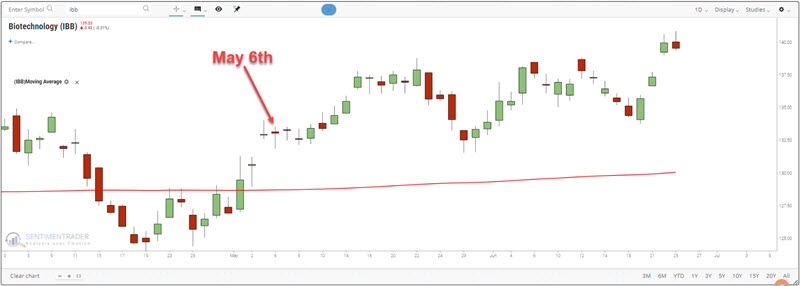
The good news is that price and Seasonality are both presently favorable. This gives us hope that the nascent rally will continue to the upside. However, one problem is that IBB tested its previous resistance level during the short advance but failed to punch through.
The longer the price fails to break through to the upside, the greater the risk that the current open gain may be erased. Traders should watch for an upside breakout in IBB to confirm the uptrend.
Price and Seasonality still are favorable… for now
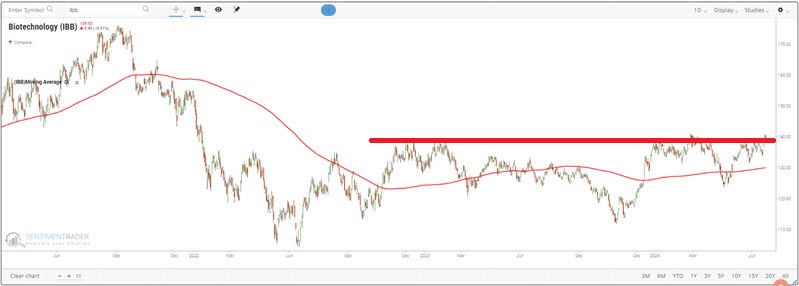
We can see from the chart above that IBB is trading above its 200-day moving average. In the most simplistic terms, we can assert that as long as the price holds above this average, the price trend can be designated as favorable.
The chart below shows that the Annual Seasonal Trend for IBB remains favorable through Trading Day of Year (TDY) #144, or 2024-07-29. Note also that historically, July has been the second-best month of the year for IBB.
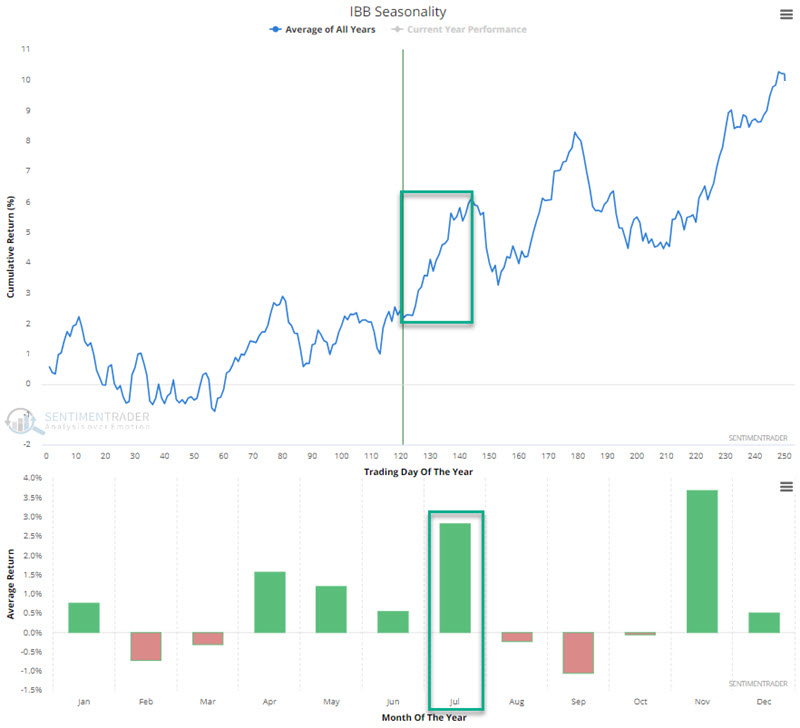
Does this confluence of price and seasonality "guarantee" higher prices for IBB? Unfortunately, "No." But trading is a game of odds. While there are no "sure things," focusing on opportunities with favorable price and seasonality factors aligned can help improve one's odds of success.
Historical performance during the remainder of this favorable seasonal window
Ticker IBB started trading in 2001. The chart below displays the hypothetical growth of $1 invested in IBB only during the TDY #121 through TDY #144 period every year since then.
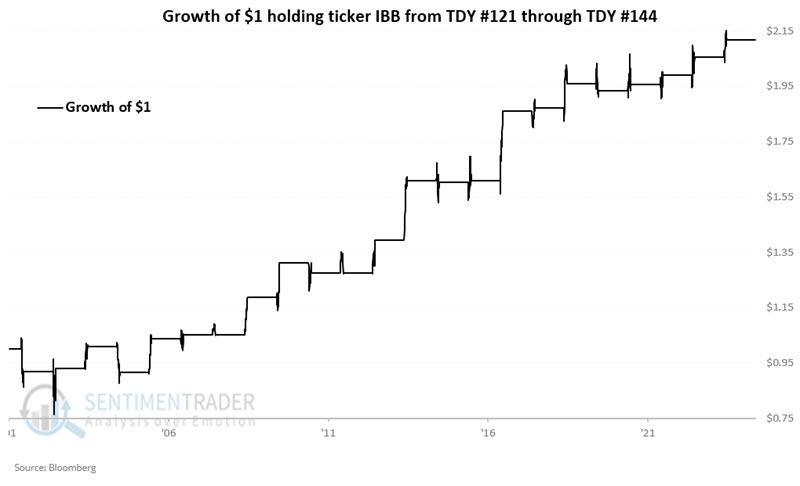
The table below summarizes IBB's performance during this period.
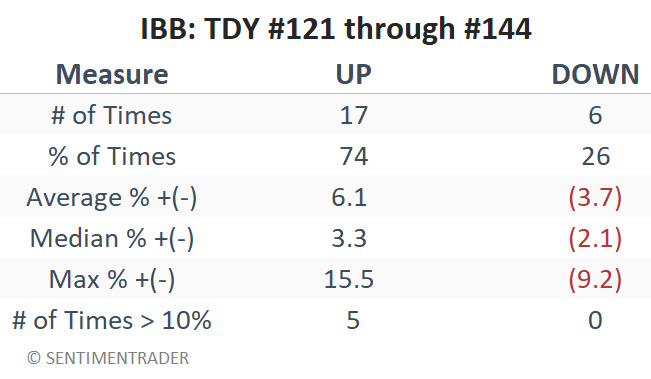
What the research tells us…
Historical results during the seasonal period highlighted have skewed to the positive side. Likewise, IBB is holding above its 200-day moving average, another reason to be optimistic. In the end, however, success or failure this time around will likely depend on whether IBB can take out its previous resistance level of $141.03 a share. A move above that level could pave the way for a quick, sharp advance during the month of July. However, the longer the price holds below that level - and/or the more time it tests that level and fails to punch through - the greater the risk of a downside reversal.